


Cryptocurrency values fluctuated within a certain range last week as digital currencies were pushed to the sidelines amid economic uncertainties.
Inflows into exchange-traded funds (ETFs) were negative, with Bitcoin ETFs recording a net outflow of $62.9 million, while Ethereum ETFs saw $8.9 million leave.
Bitcoin
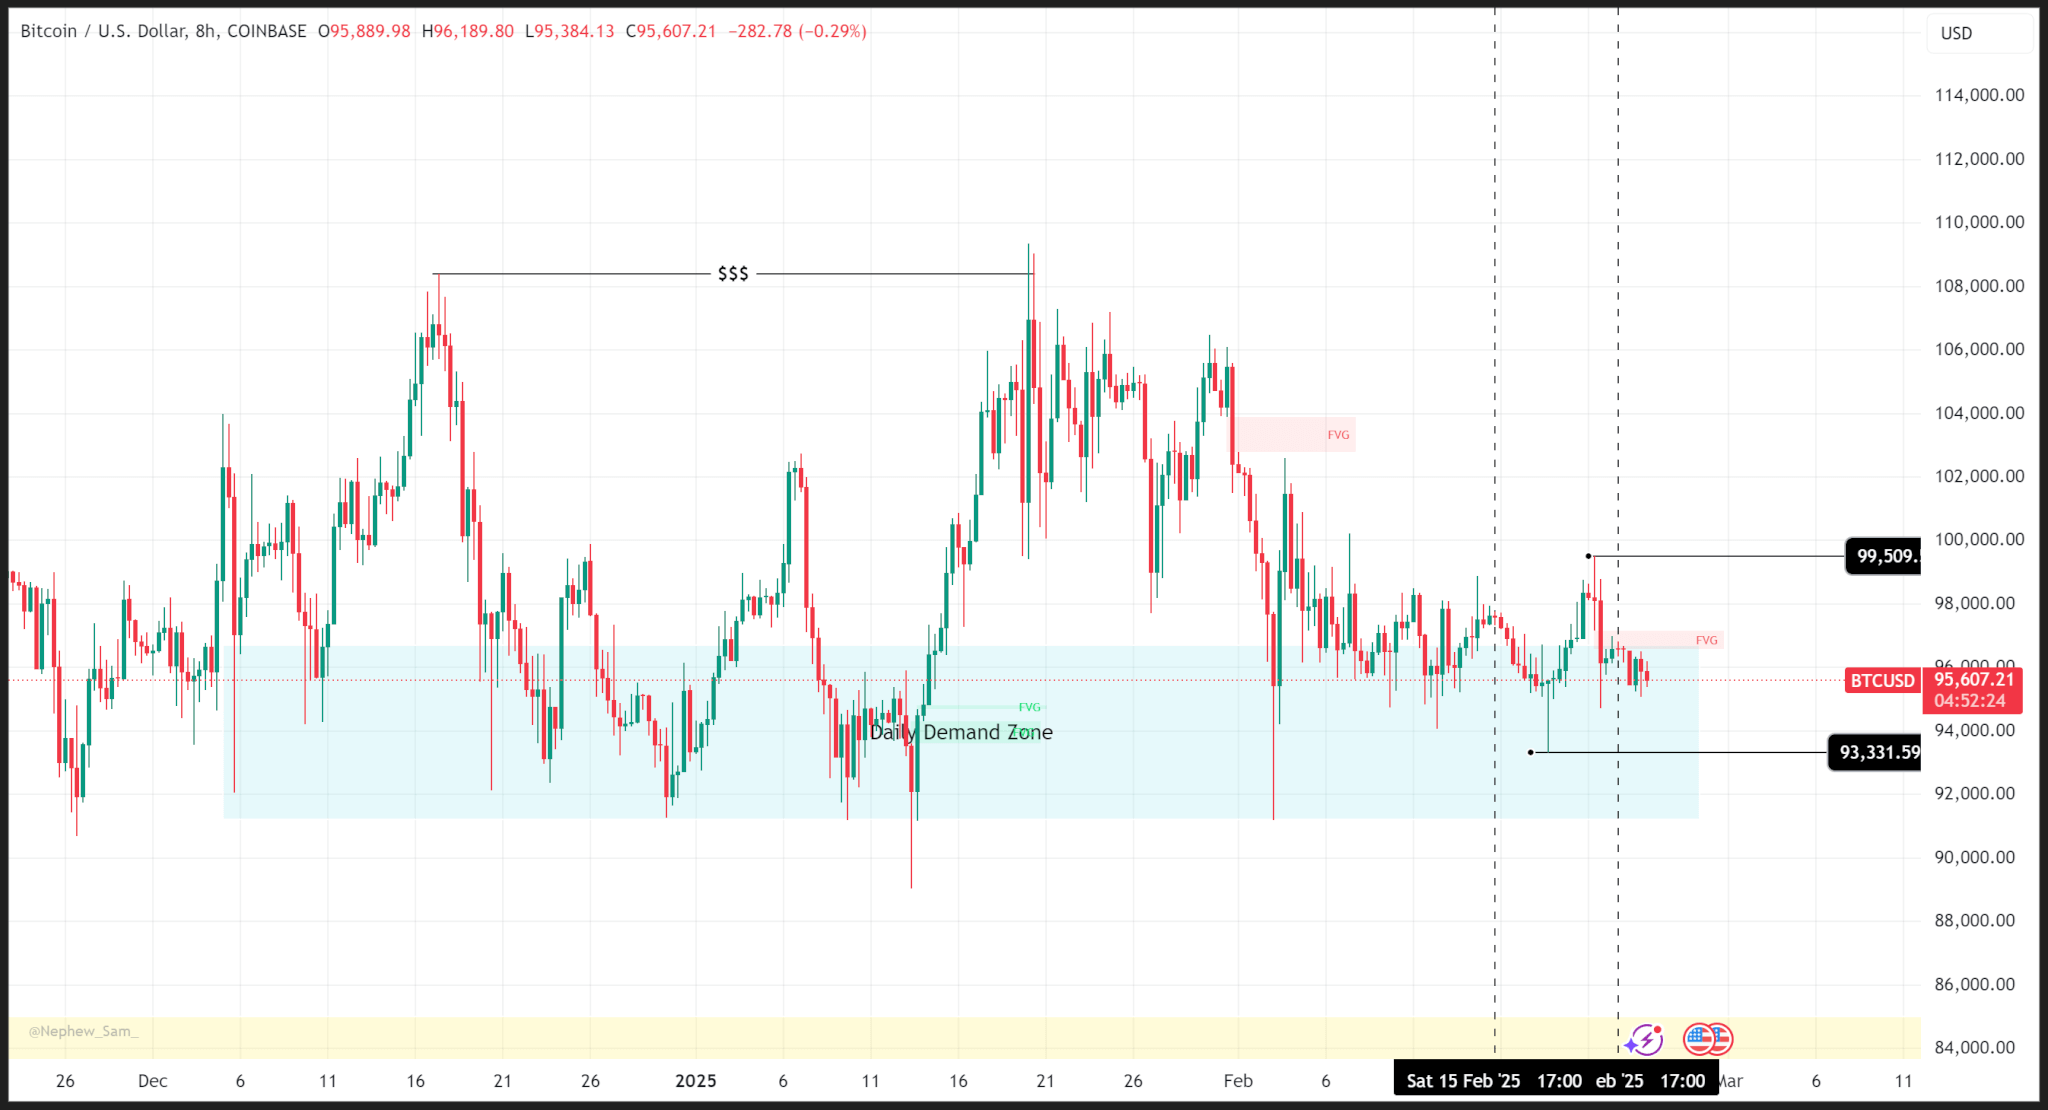
The price movements of Bitcoin continued within a confined range, noting weekly highs and lows at $99,509 and $93,331, as ambiguity surrounds inflation, the policies of US President Donald Trump, and various geopolitical incidents.
Looking at the broader picture, it is evident that the price has remained at the daily support level for three consecutive weeks due to the lack of significant catalysts to drive prices to new peaks.
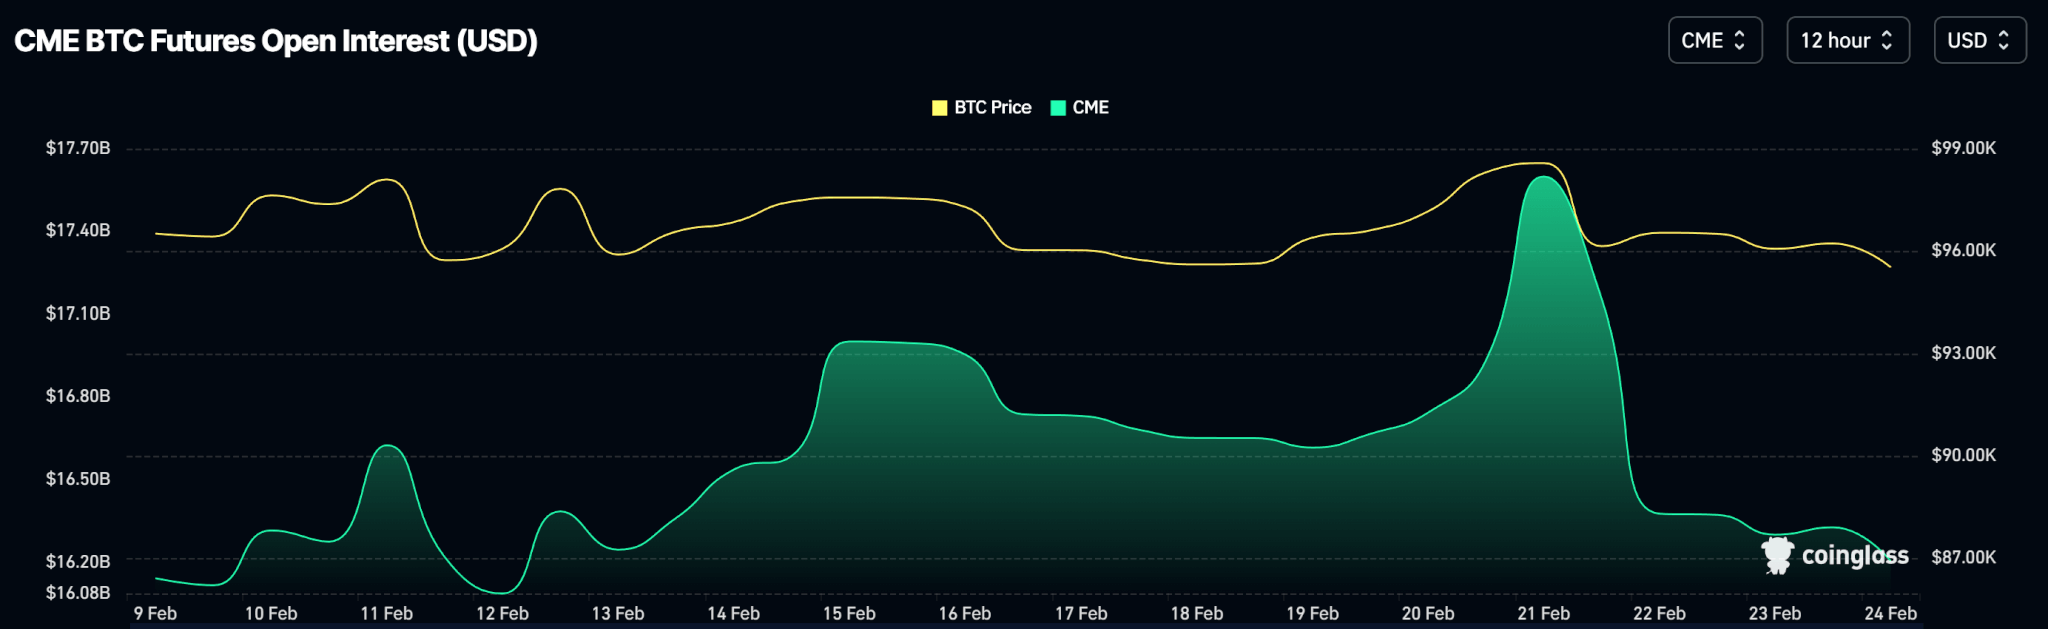
Open interest reflects the price dynamics, with a decrease in open contracts at the beginning of the week, rebounding on Wednesday, February 19, aligning with the price trends.

Outlook
Bitcoin must stay above the daily support level of $90,673 to remain in bullish territory. A close beneath this threshold on the daily timeframe could lead to a decline towards the $84,000 mark.
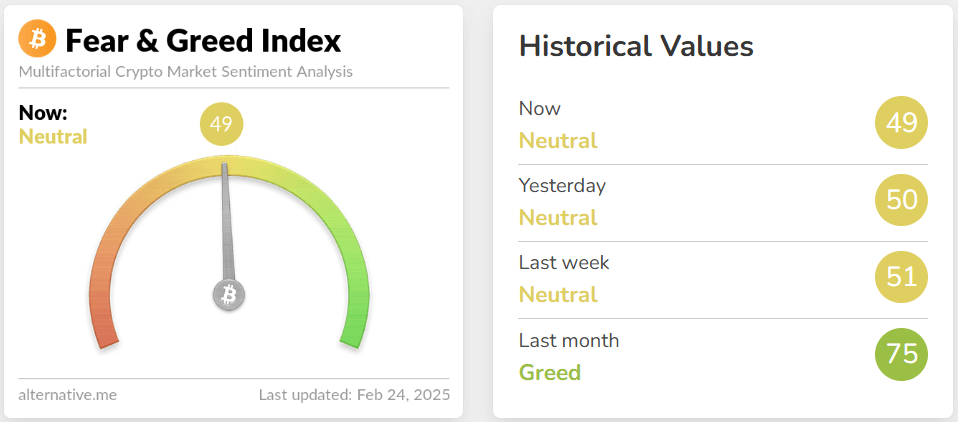
Conversely, market sentiment has significantly cooled over the past month and currently stands in neutral territory.
Bitcoin is trading at $87,900 at the time of publication.
Ethereum
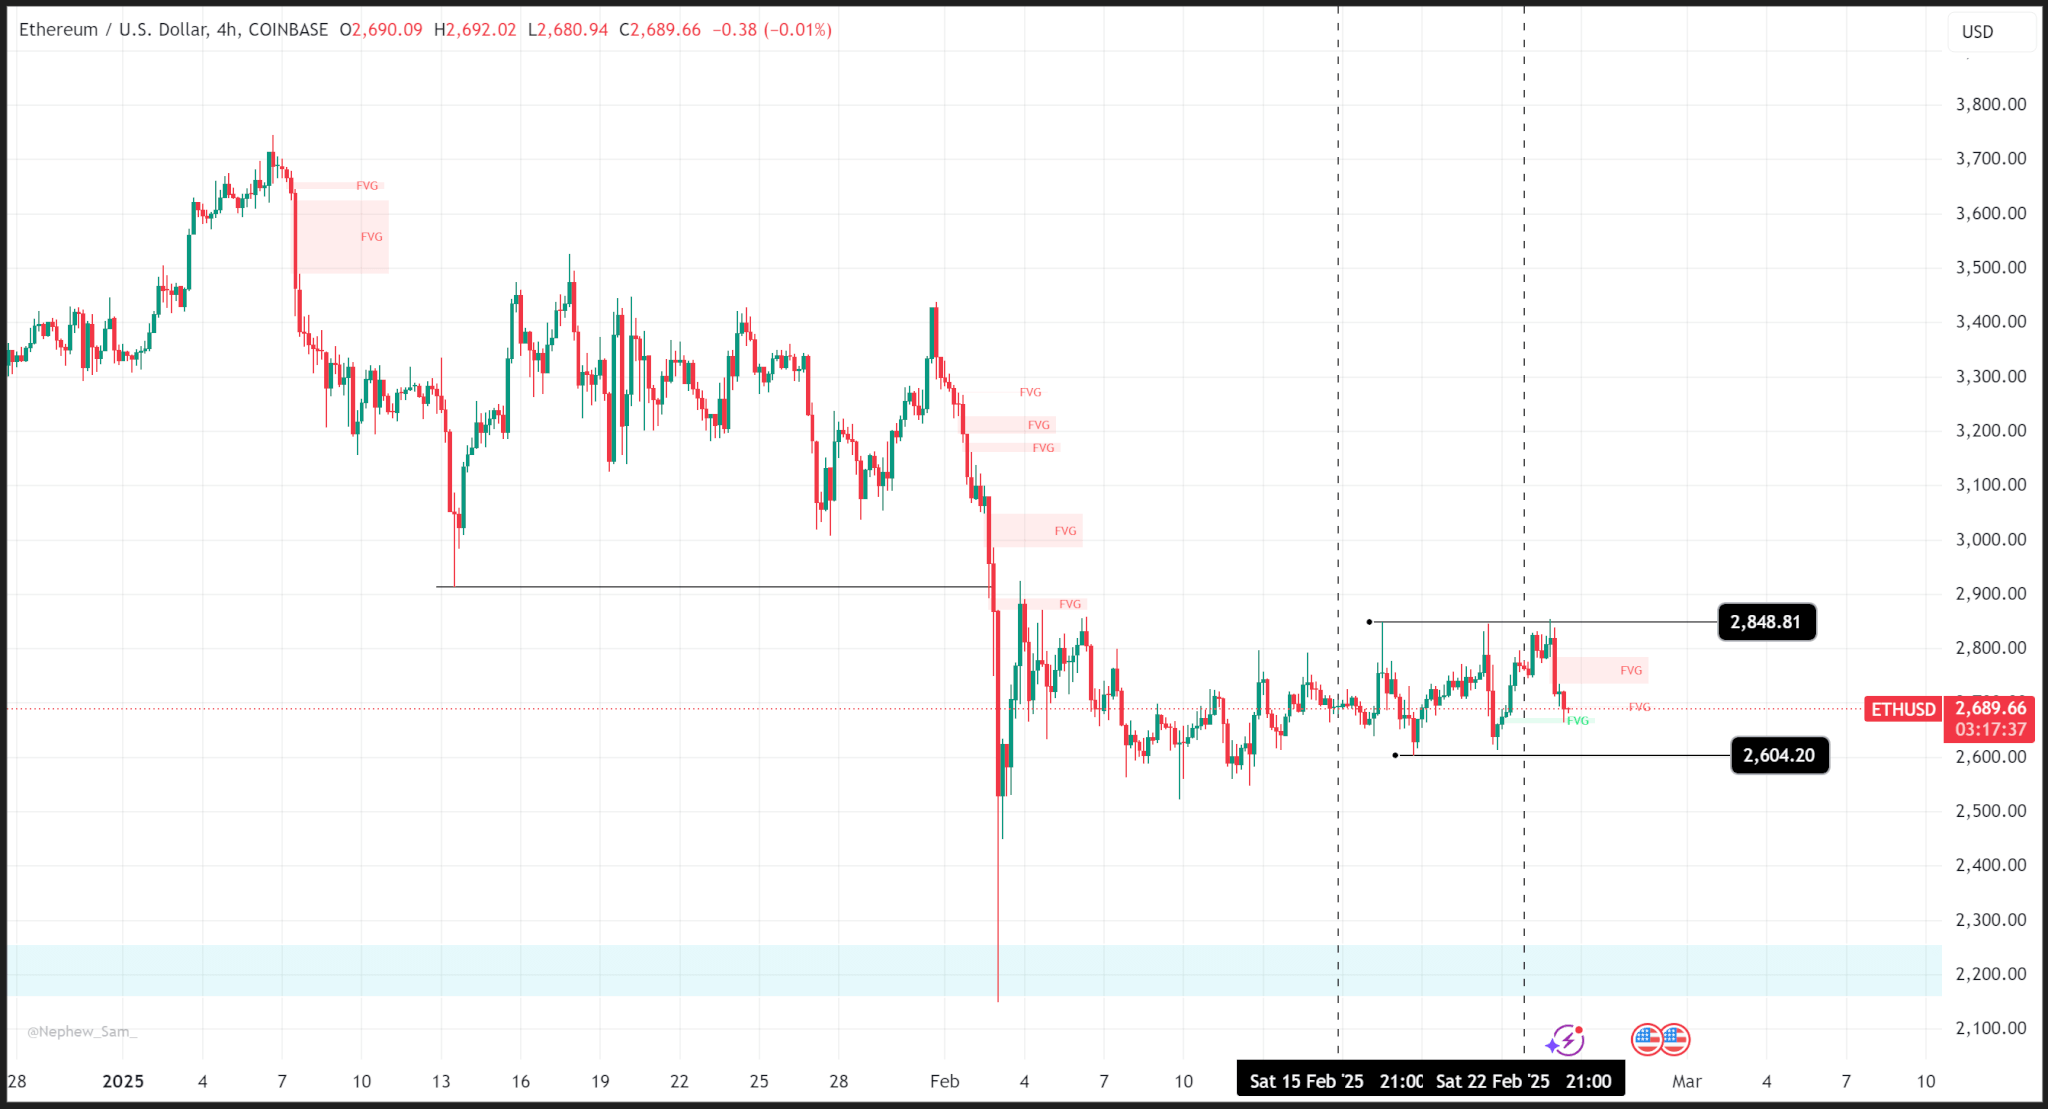
Ethereum’s movements reflected a range last week, recording a weekly high of $2,848 and a low of $2,604 despite the previous week’s Bybit hack incident.
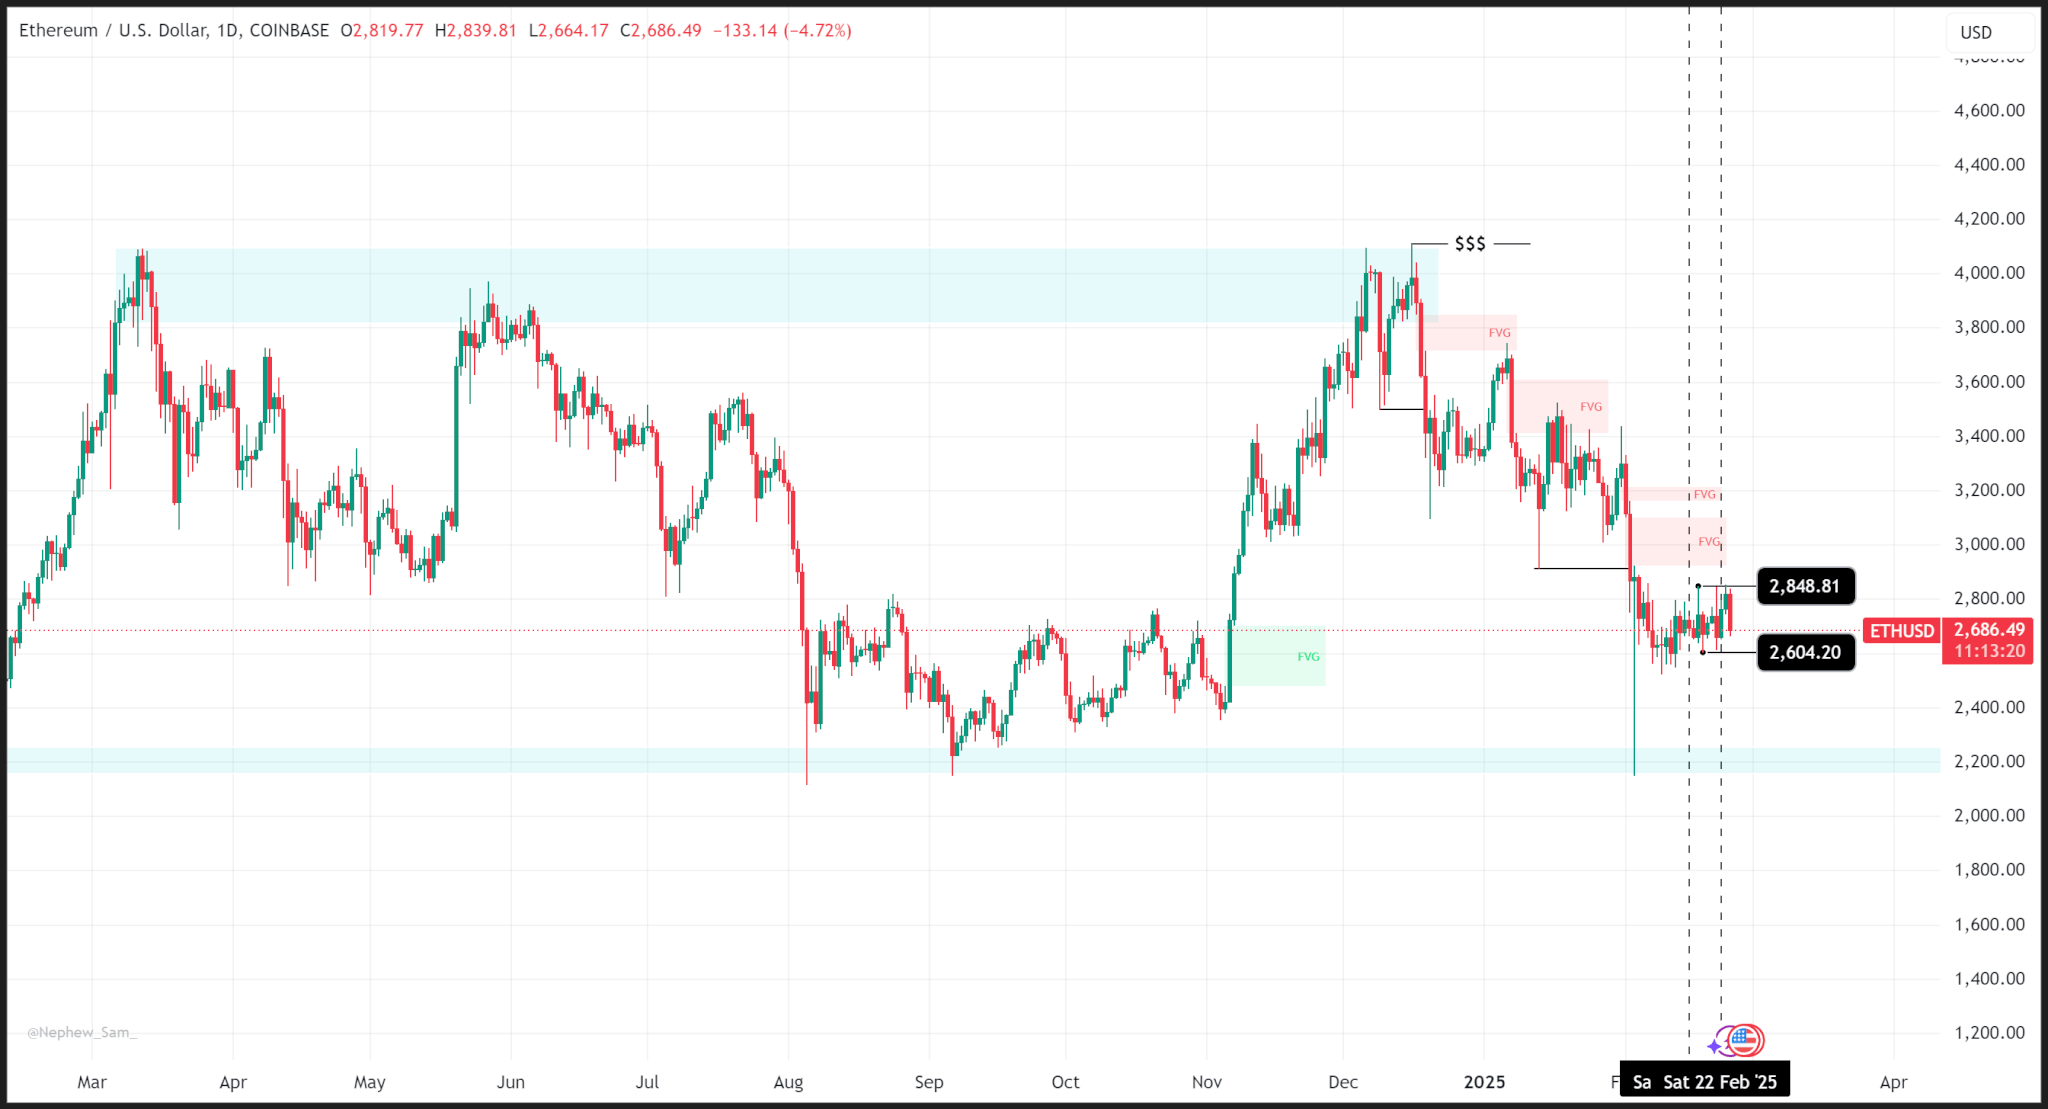
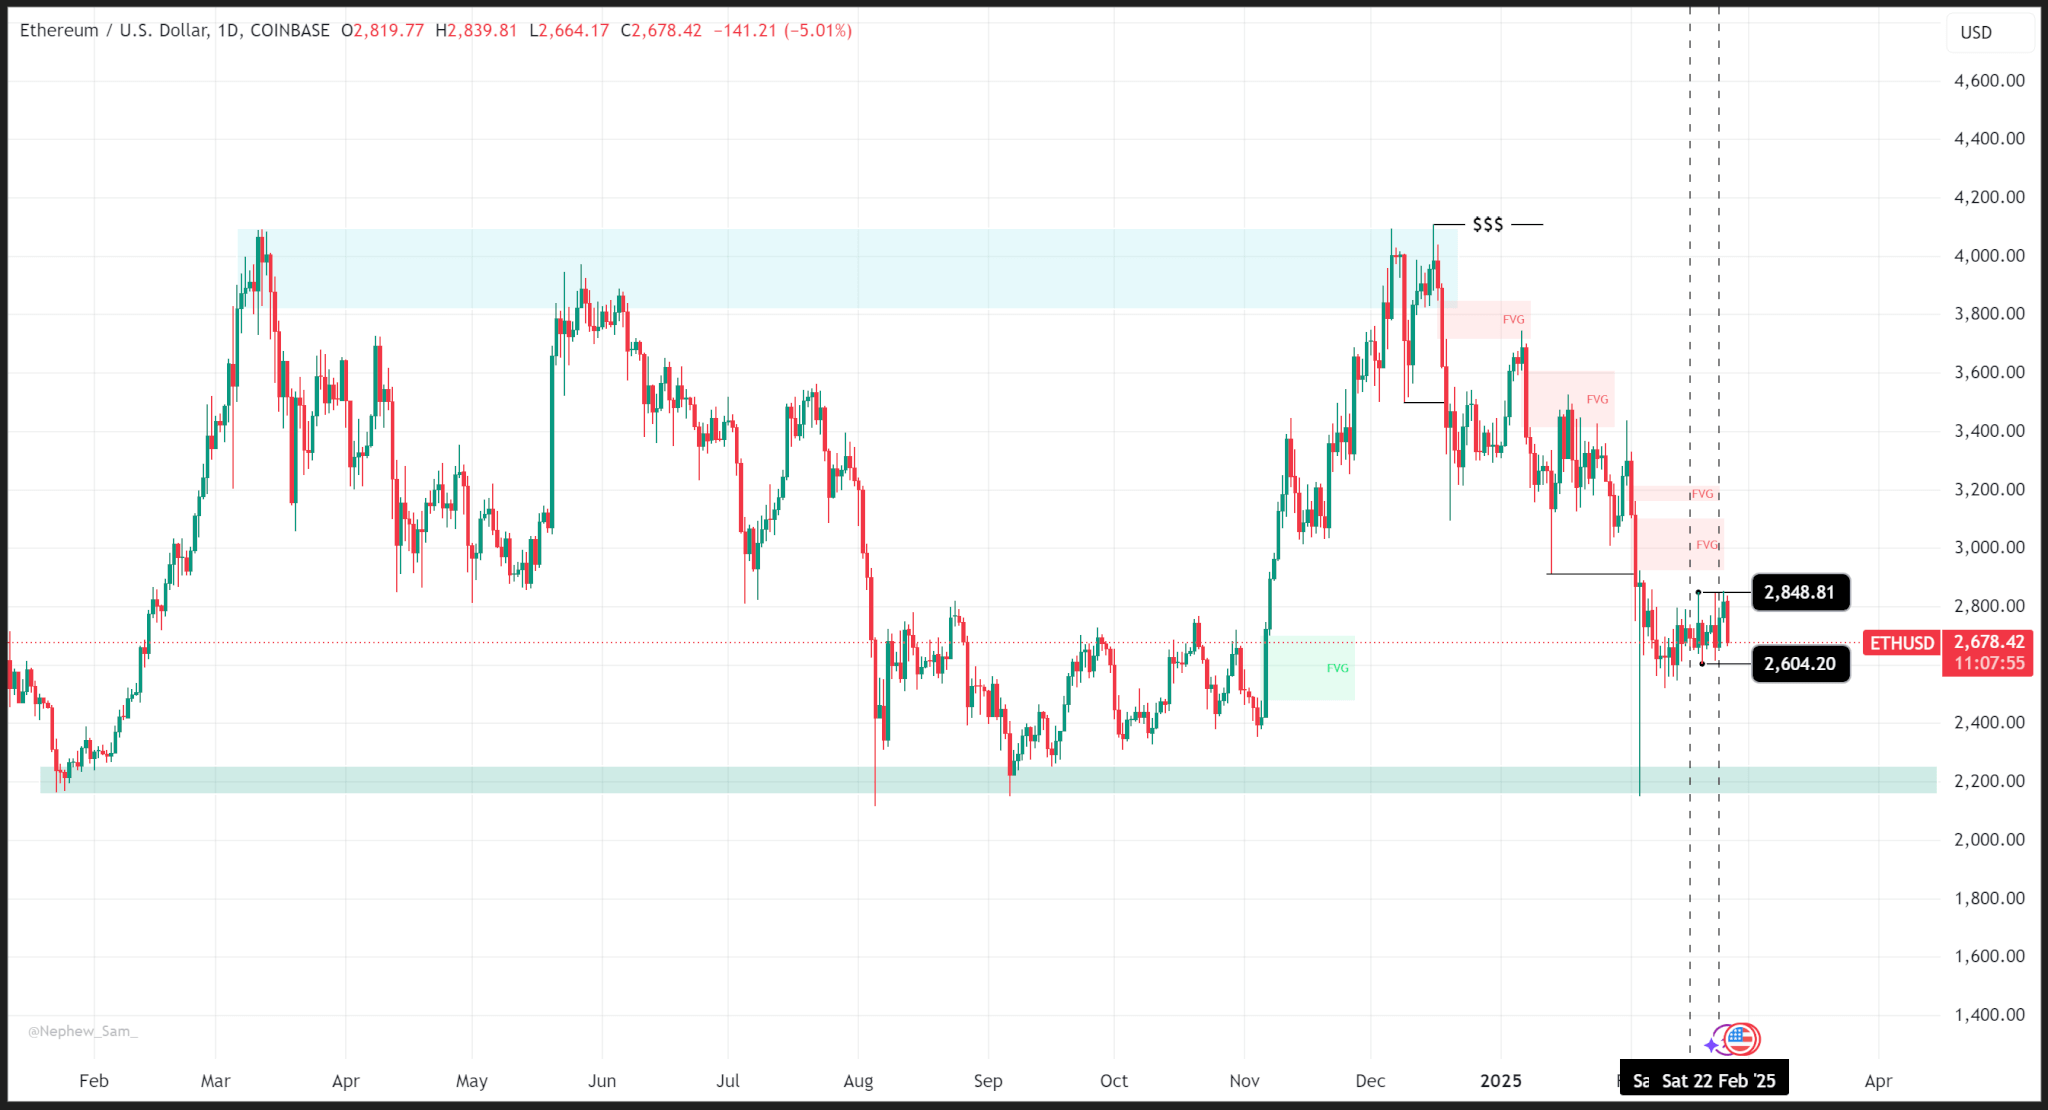
On a broader scale, the outlook appears less optimistic as ETH has been trending downward since December 09 after failing to surpass its high from March 2024.
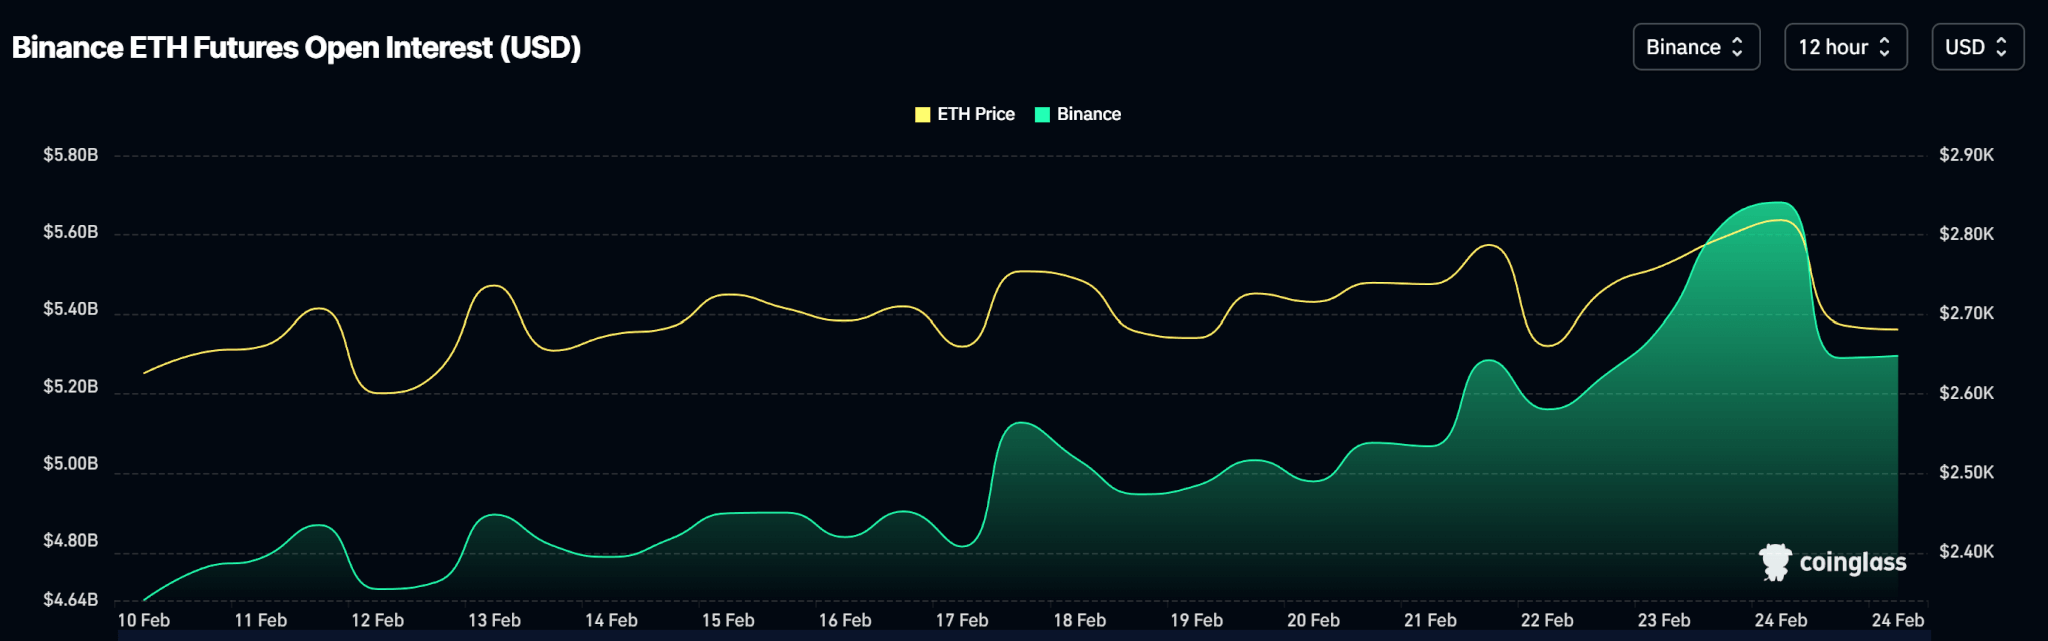
Open interest metrics indicate a steady increase in contract volume throughout the week, despite the price remaining rangebound.
Outlook
The forthcoming significant support zone for ETH is at the $2,500 mark, previously recognized as a robust liquidity threshold.
ETH is trading at $2,384 at the time of publication.
Solana
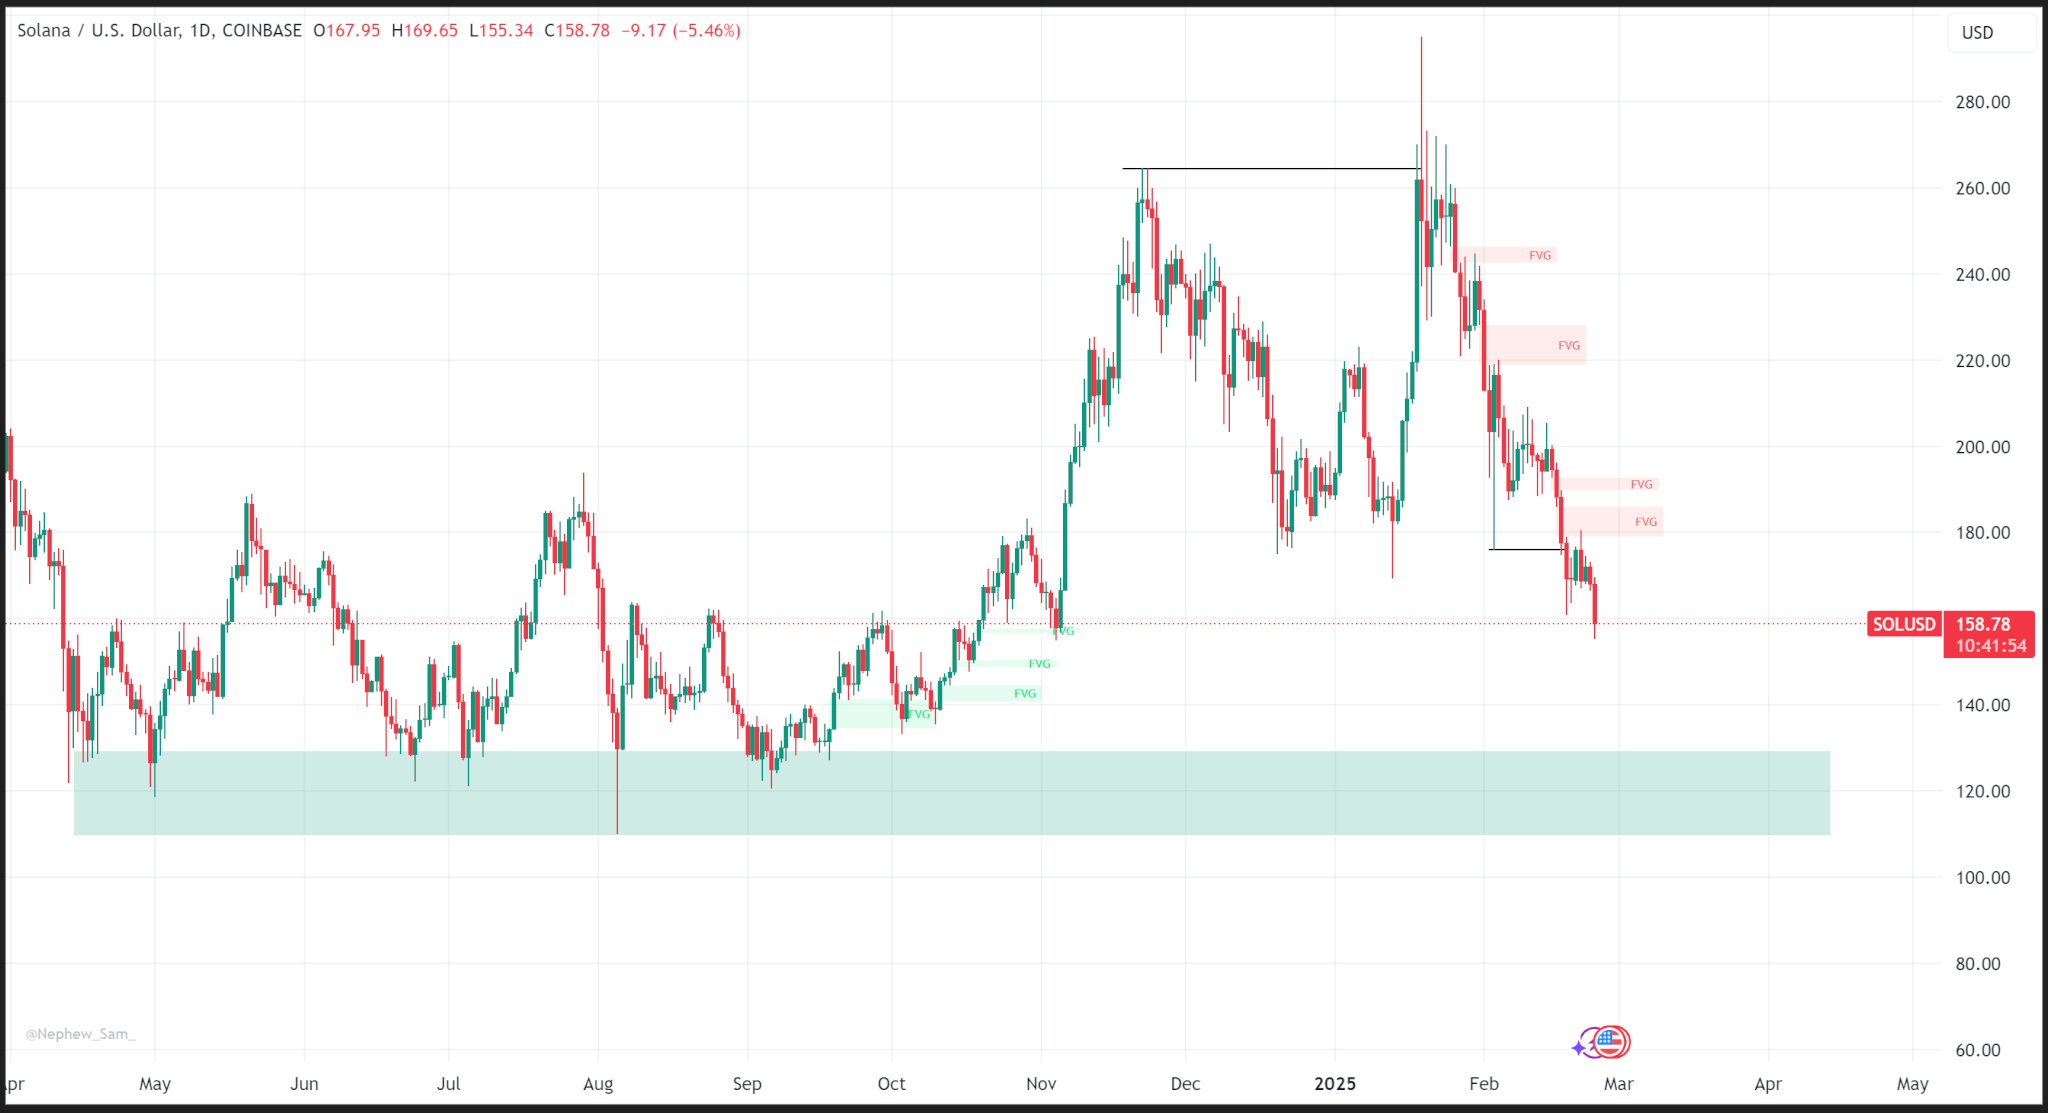
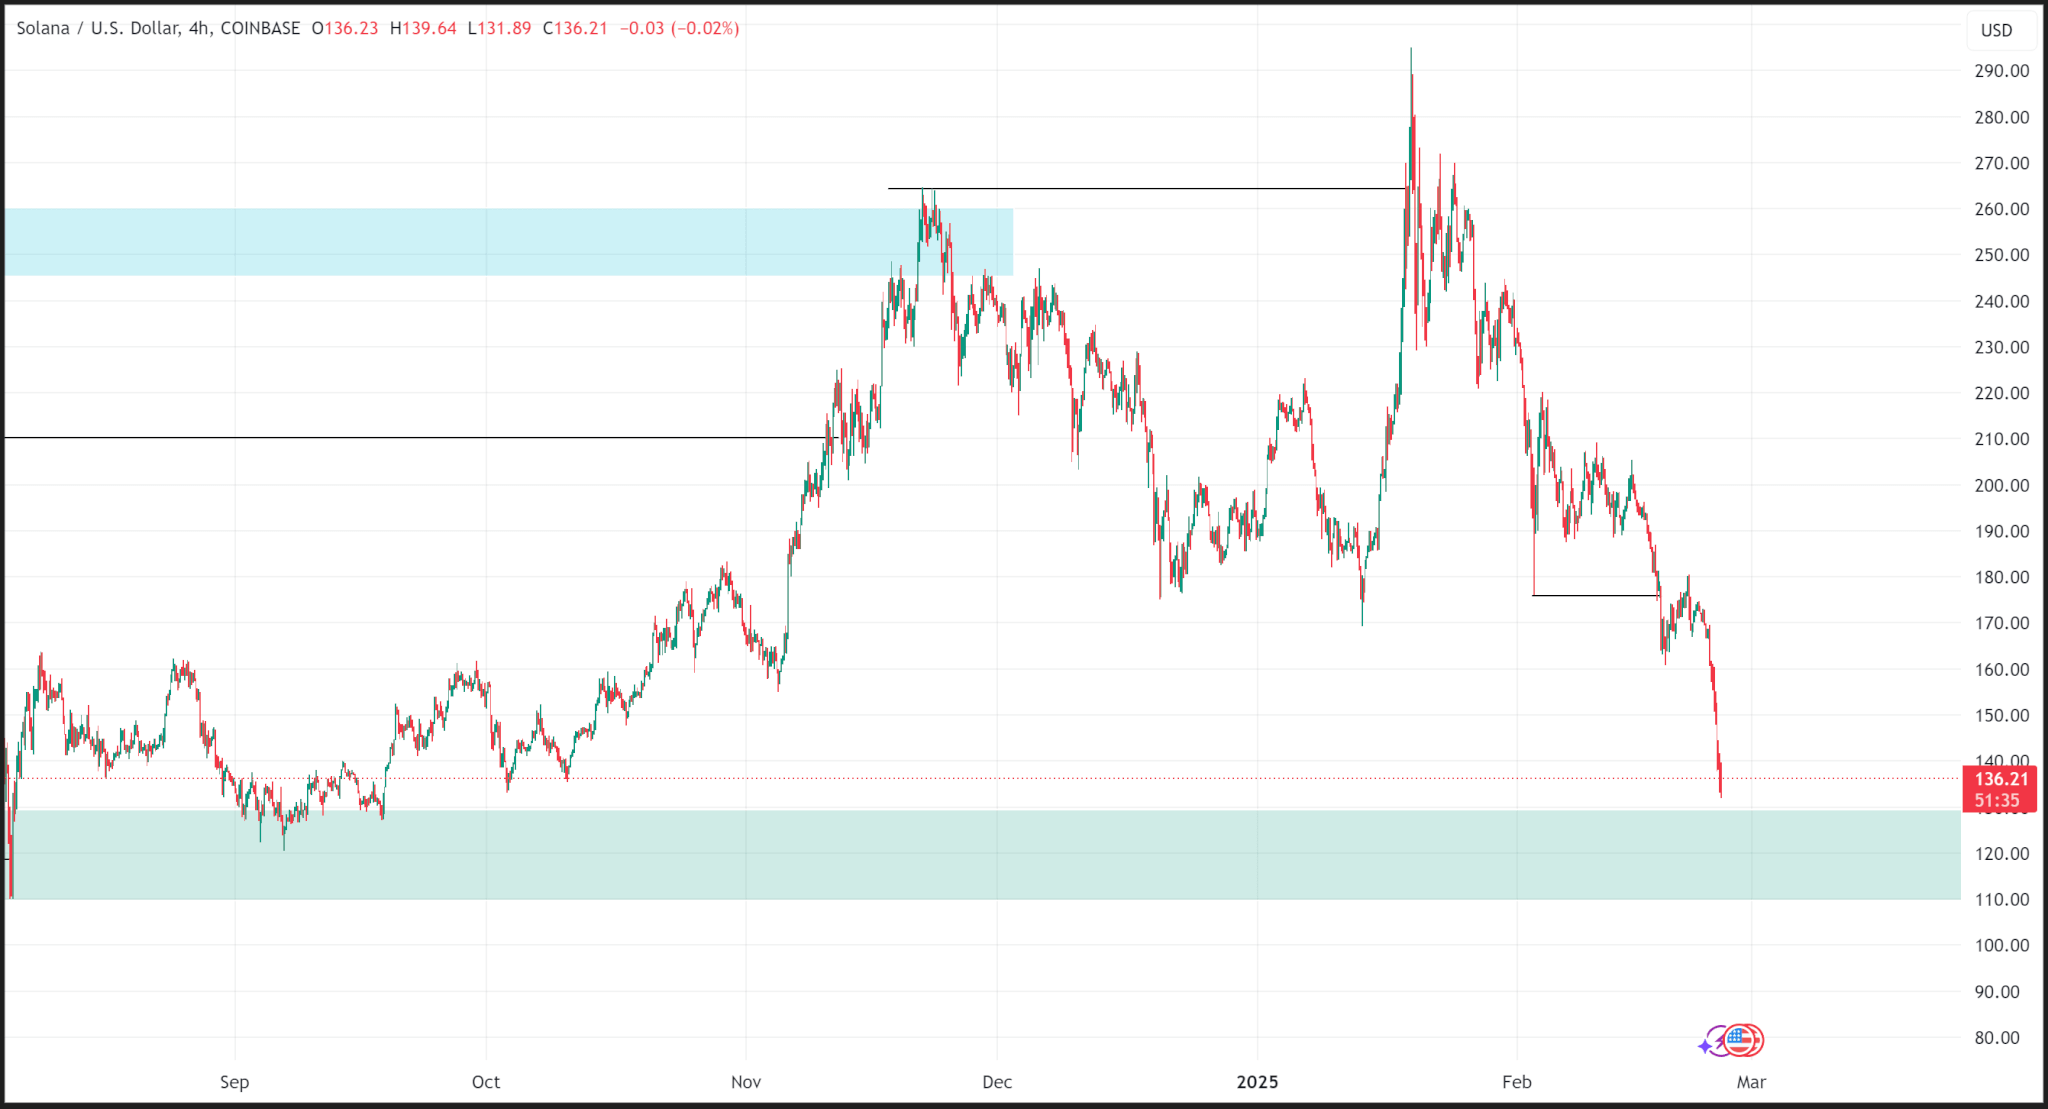
Similar to Ethereum, Solana’s price has been declining following its inability to rise and create new candles above its preceding all-time high on the daily timeframe.
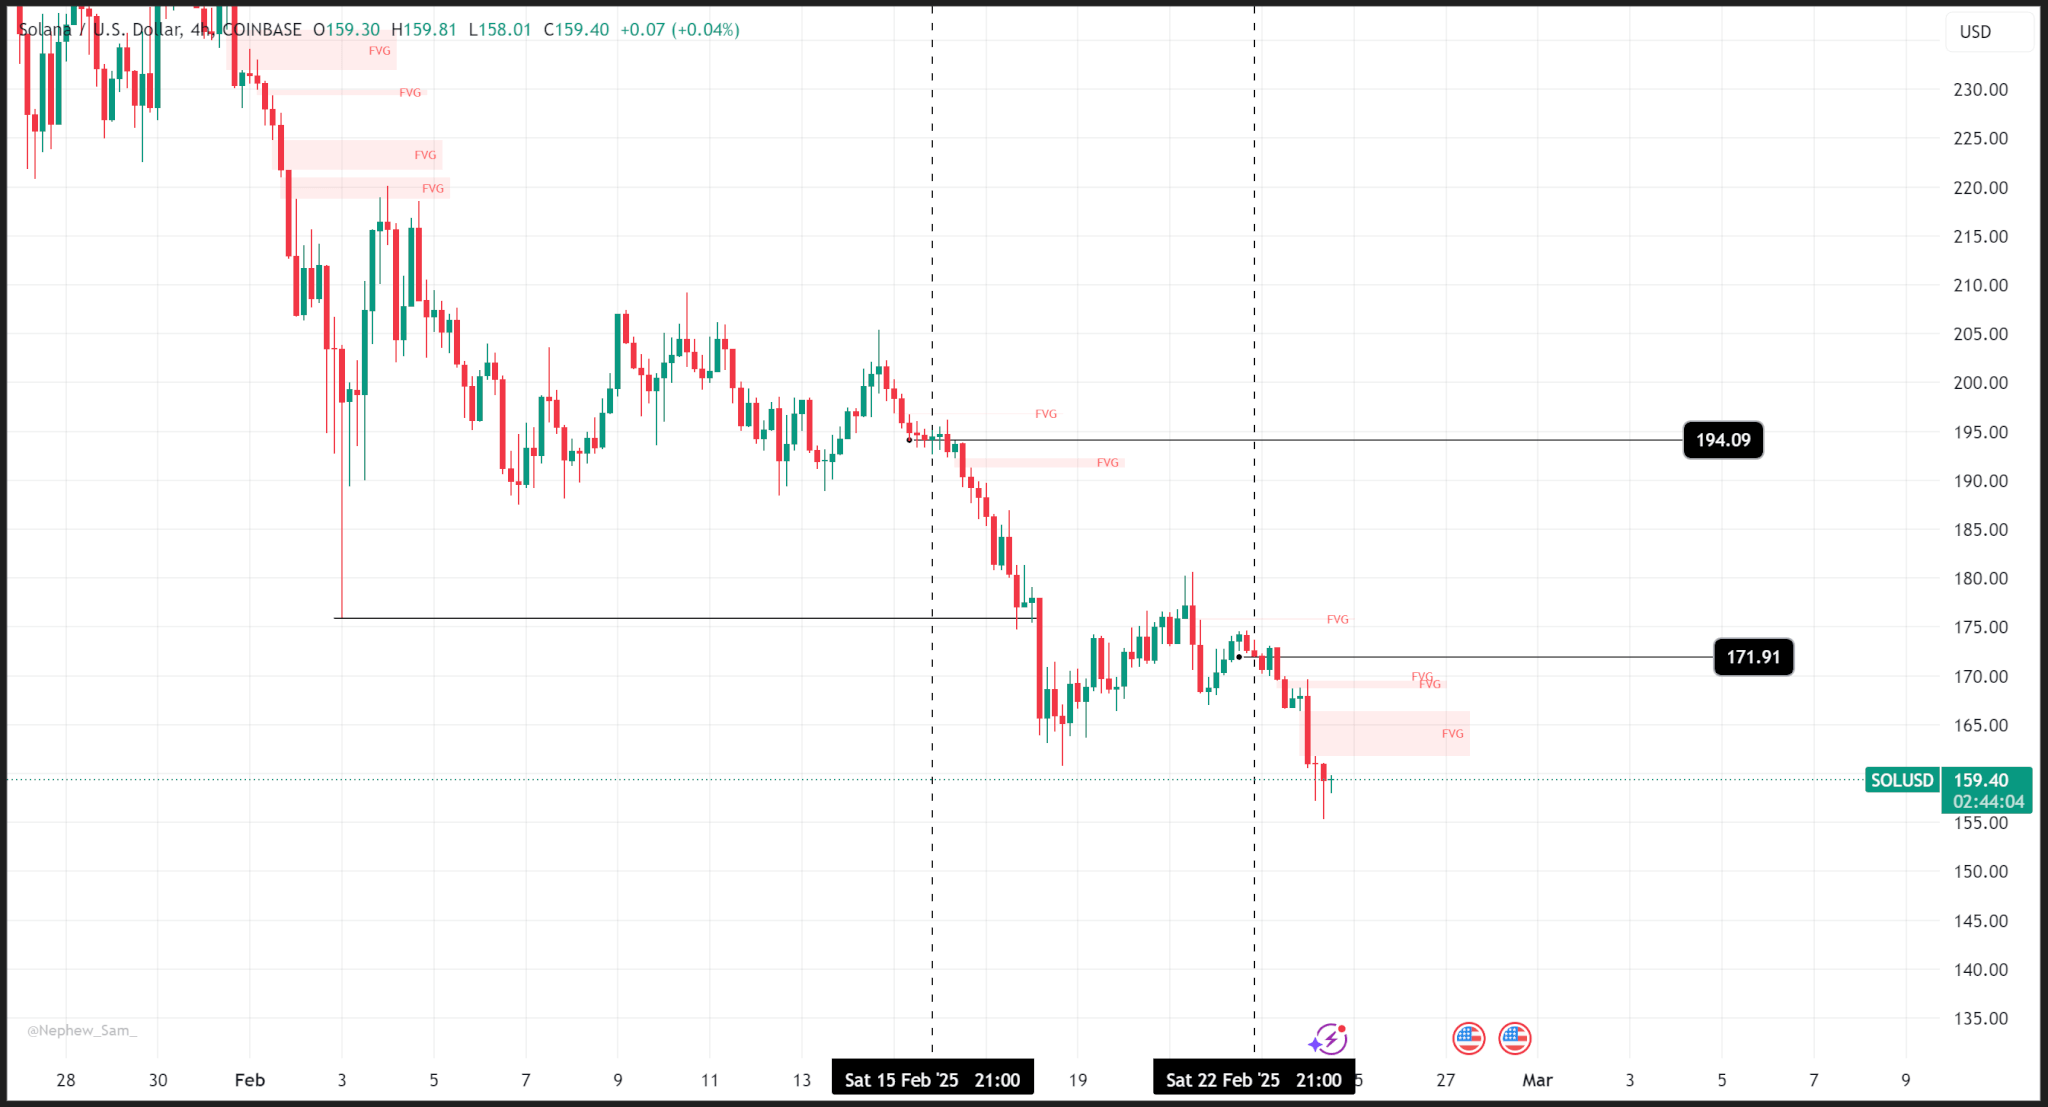
In contrast to Ethereum, the price movements last week were bearish as the price dropped from a weekly opening around $194 to closing around $171.
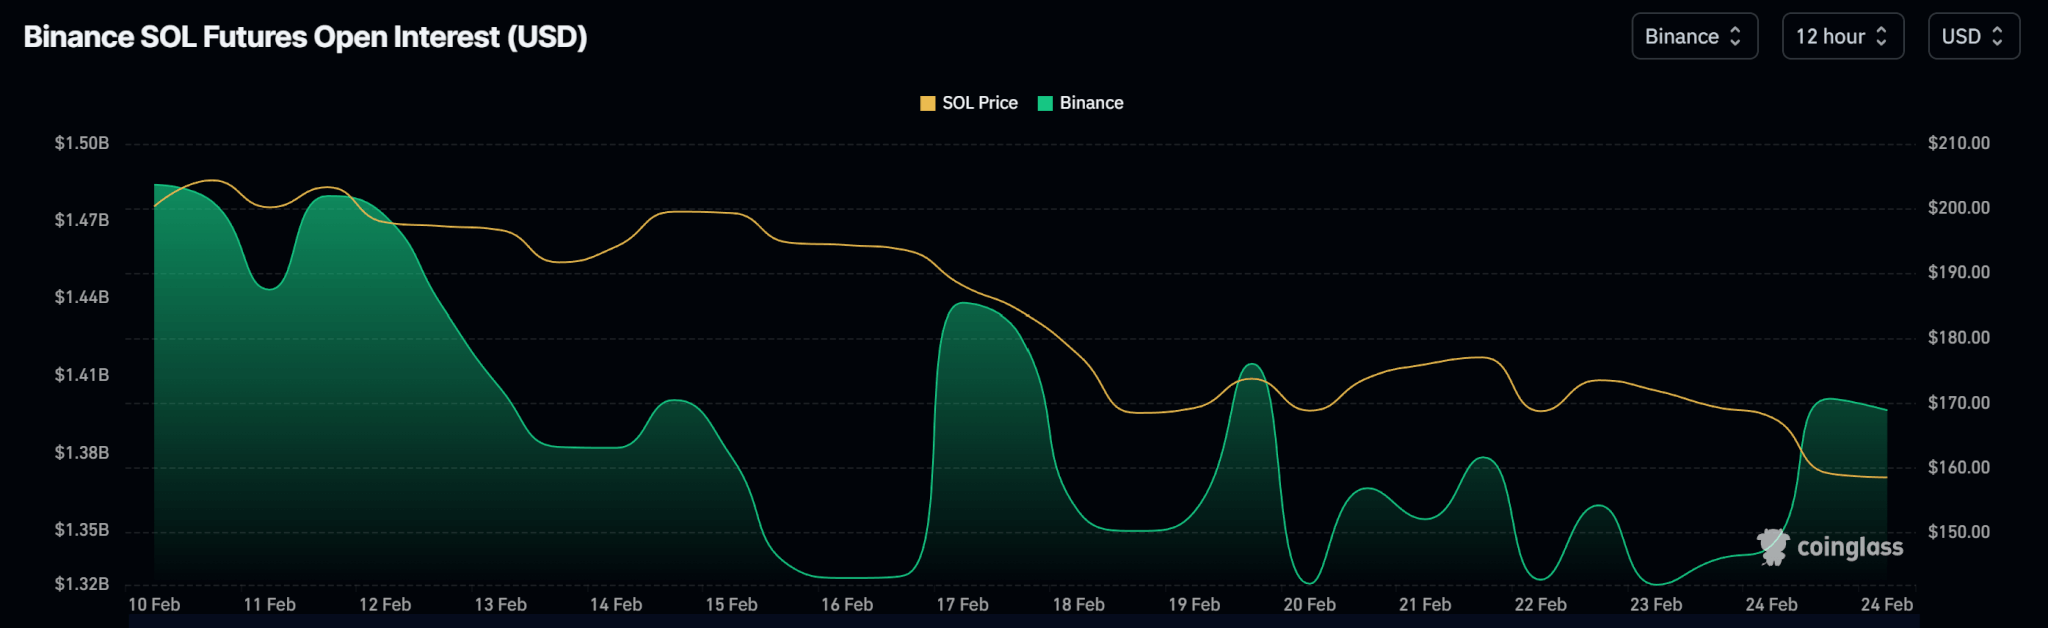
Open interest charts depict fluctuating movements in open contract volumes as the price decreases.
Outlook
The next crucial support area for Solana is situated at the $129 level. However, smaller recoveries might occur as the price generally trends downward.


Be the first to comment