


The cryptocurrency market experienced a downward trend last week as tariffs imposed by the US unsettled the market, prompting investors to move towards safe-haven assets like Gold.
Cryptocurrency prices, which saw a slight recovery on Monday and Tuesday, continued to decline amid prevailing uncertainty.
On the other hand, spot ETF inflows remained encouraging despite experiencing several days of outflows.
Bitcoin
Bitcoin’s value dropped over the past week following the announcement from US President Donald Trump regarding tariffs on Canada, Mexico, and China. Investors sought refuge in safe-haven assets like gold, leading to a decline in riskier assets such as cryptocurrencies.
Nonetheless, these tariffs act as a trigger for accelerated price drops, as Bitcoin’s price action indicates it was already undergoing a downward trend in its substructure after failing to surpass the $108,000 mark three weeks prior.
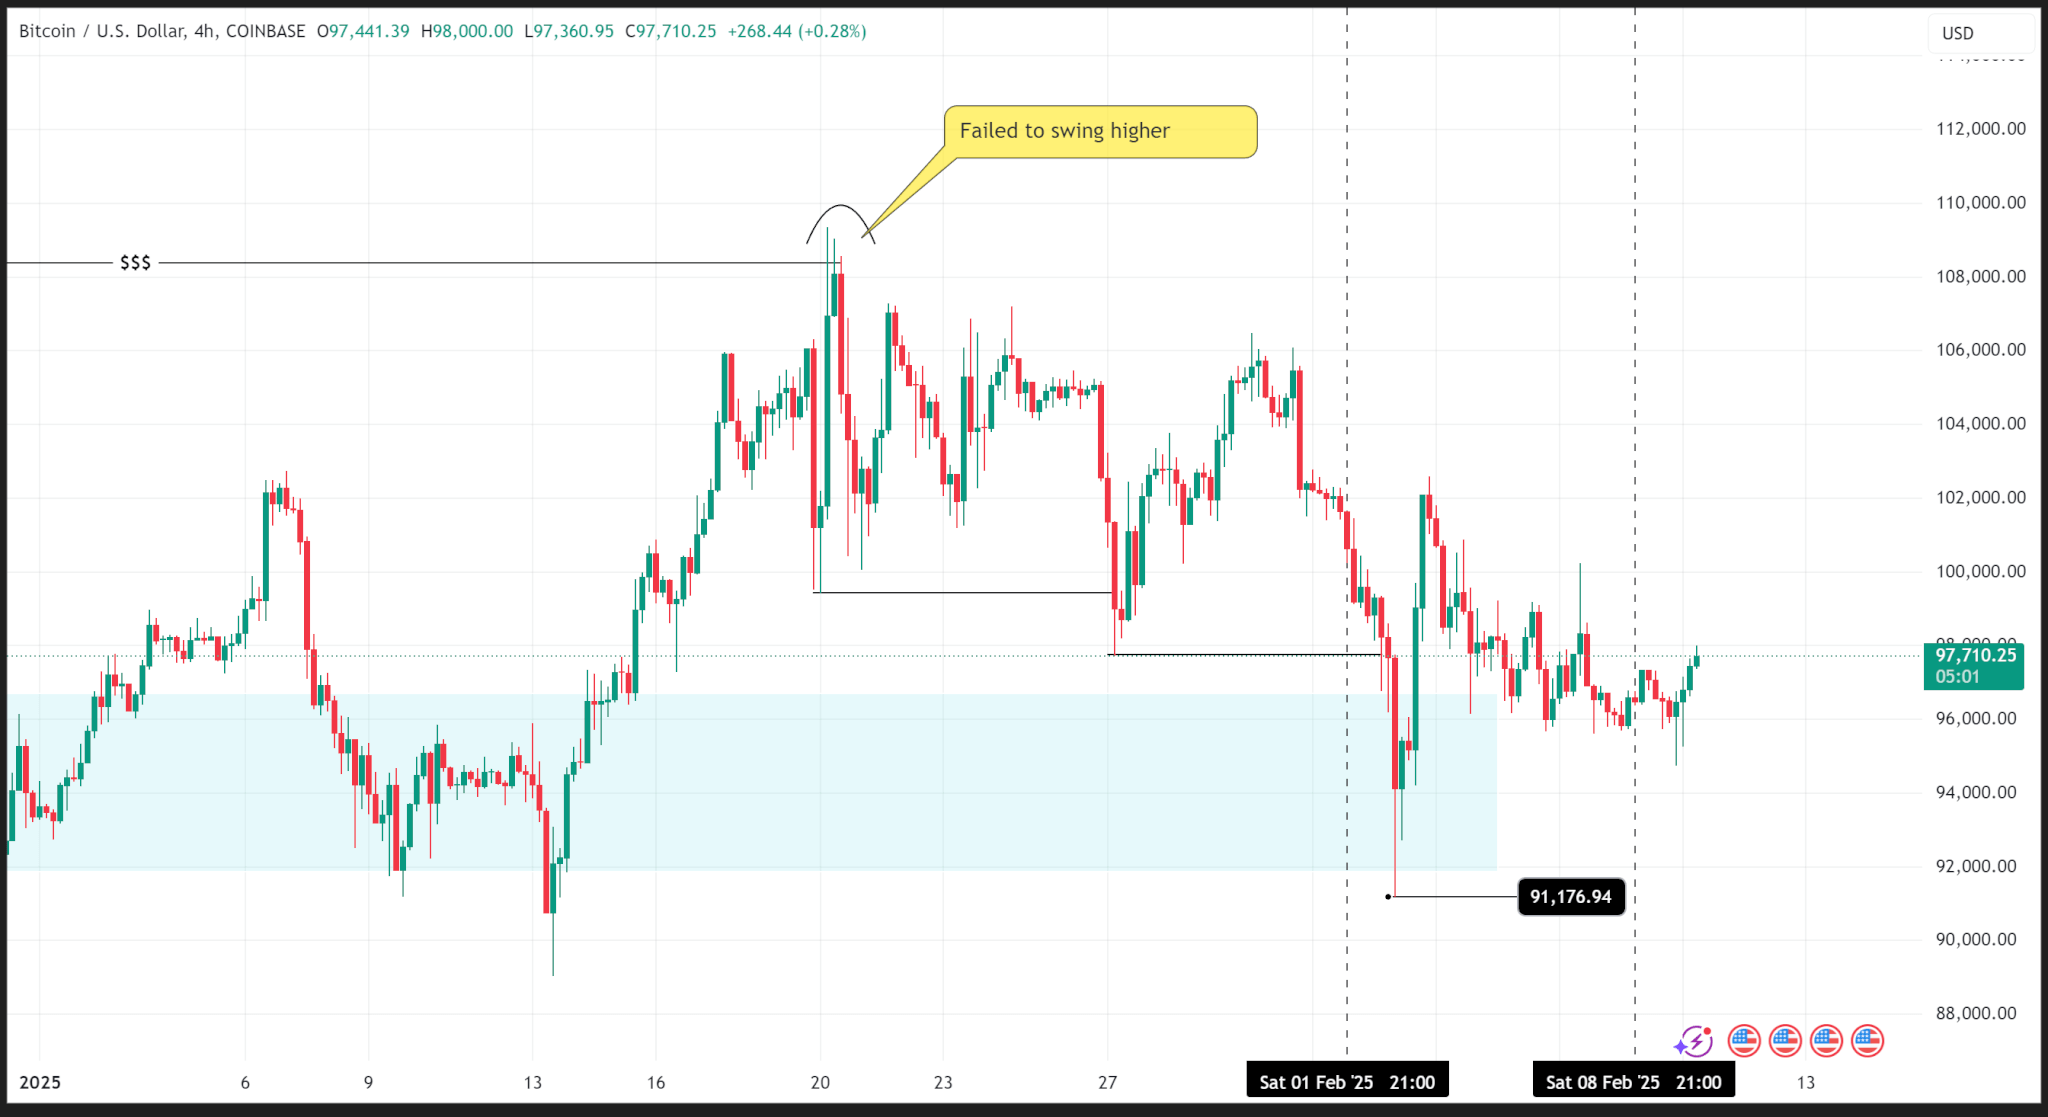
BTC recorded two consecutive lower lows in the substructure over the last two weeks and entered the daily demand zone early last week, marking a weekly low of $91,176.94.

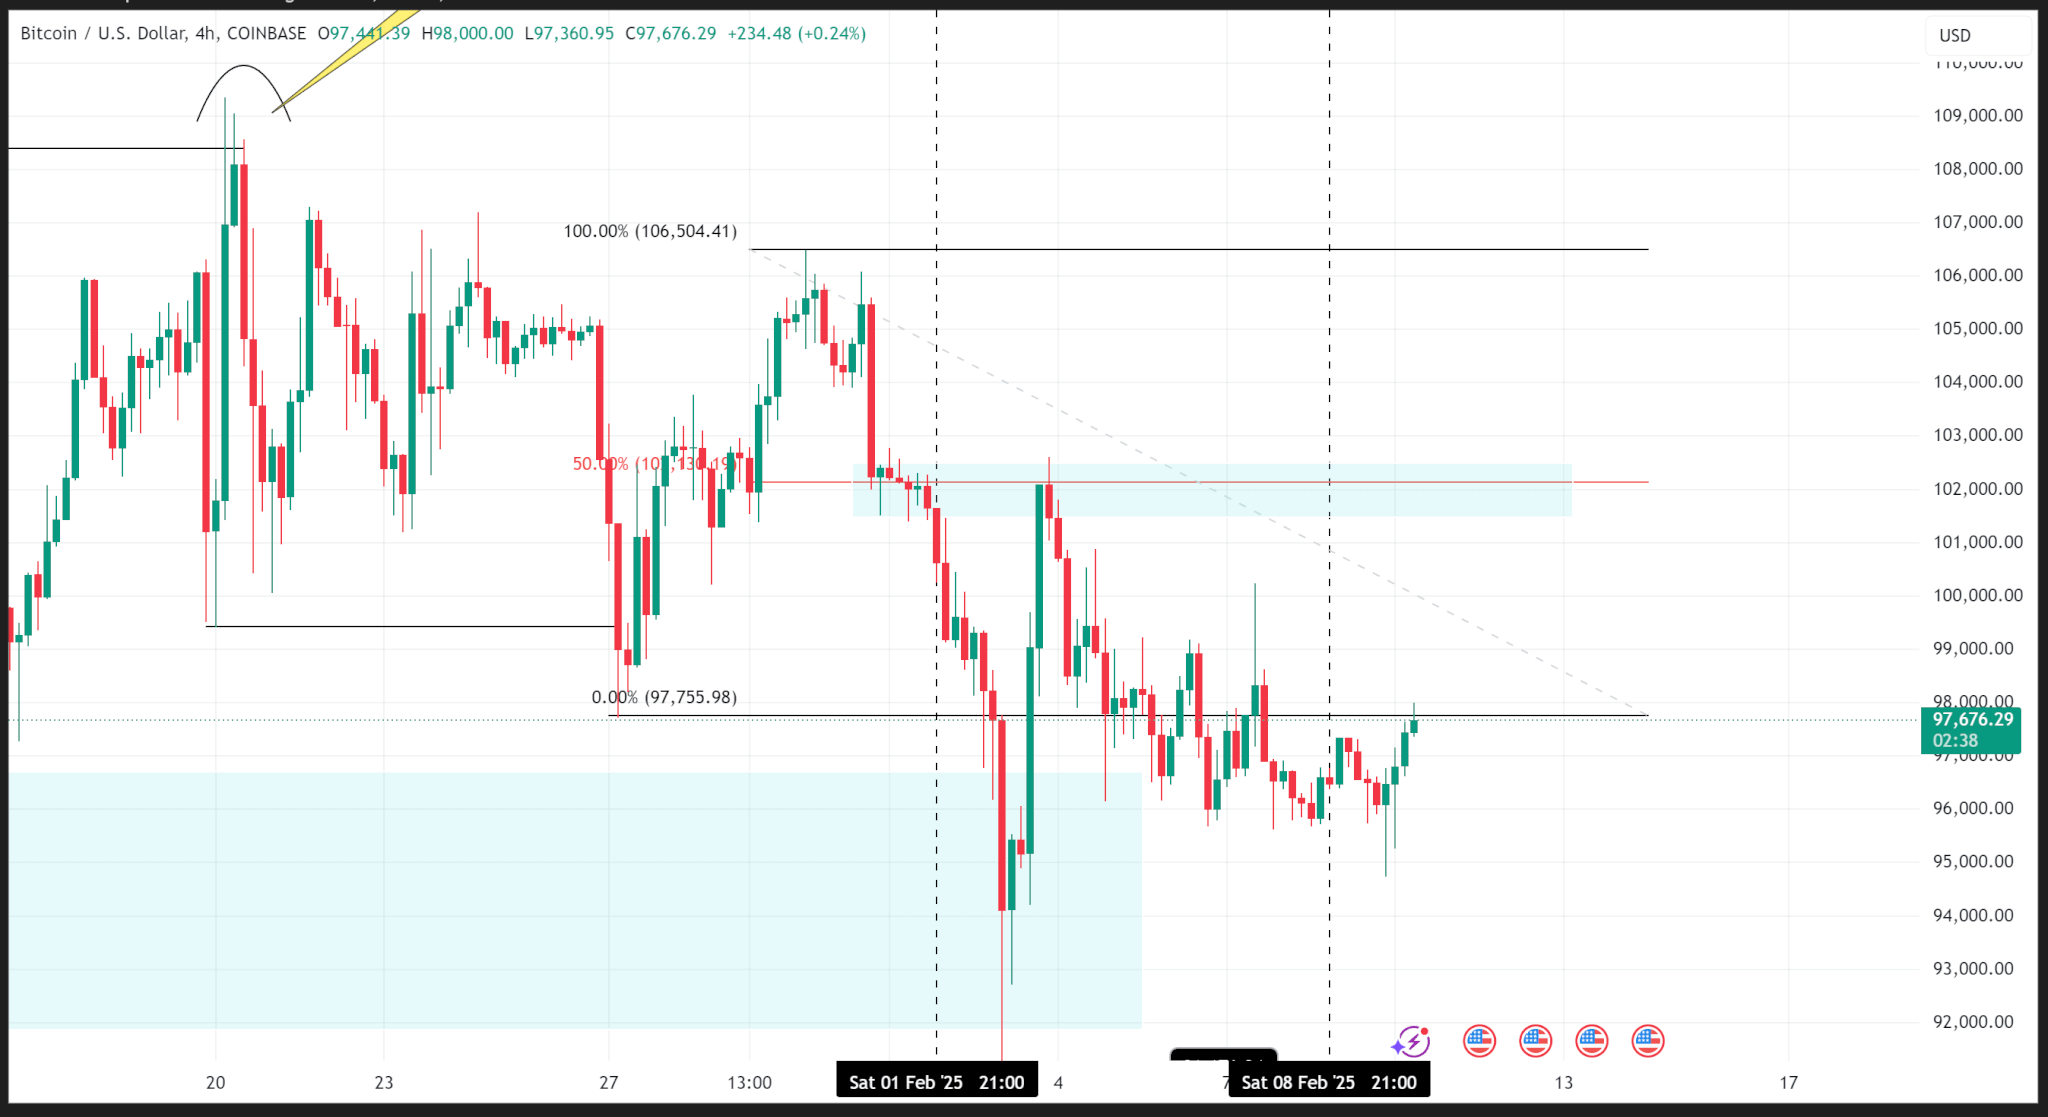
After purchasing from the demand zone, the price ascended to an internal supply zone at $102,000, confirmed by the 50% Fibonacci level, and subsequently retraced from that zone to conclude the week at $96,475.03.
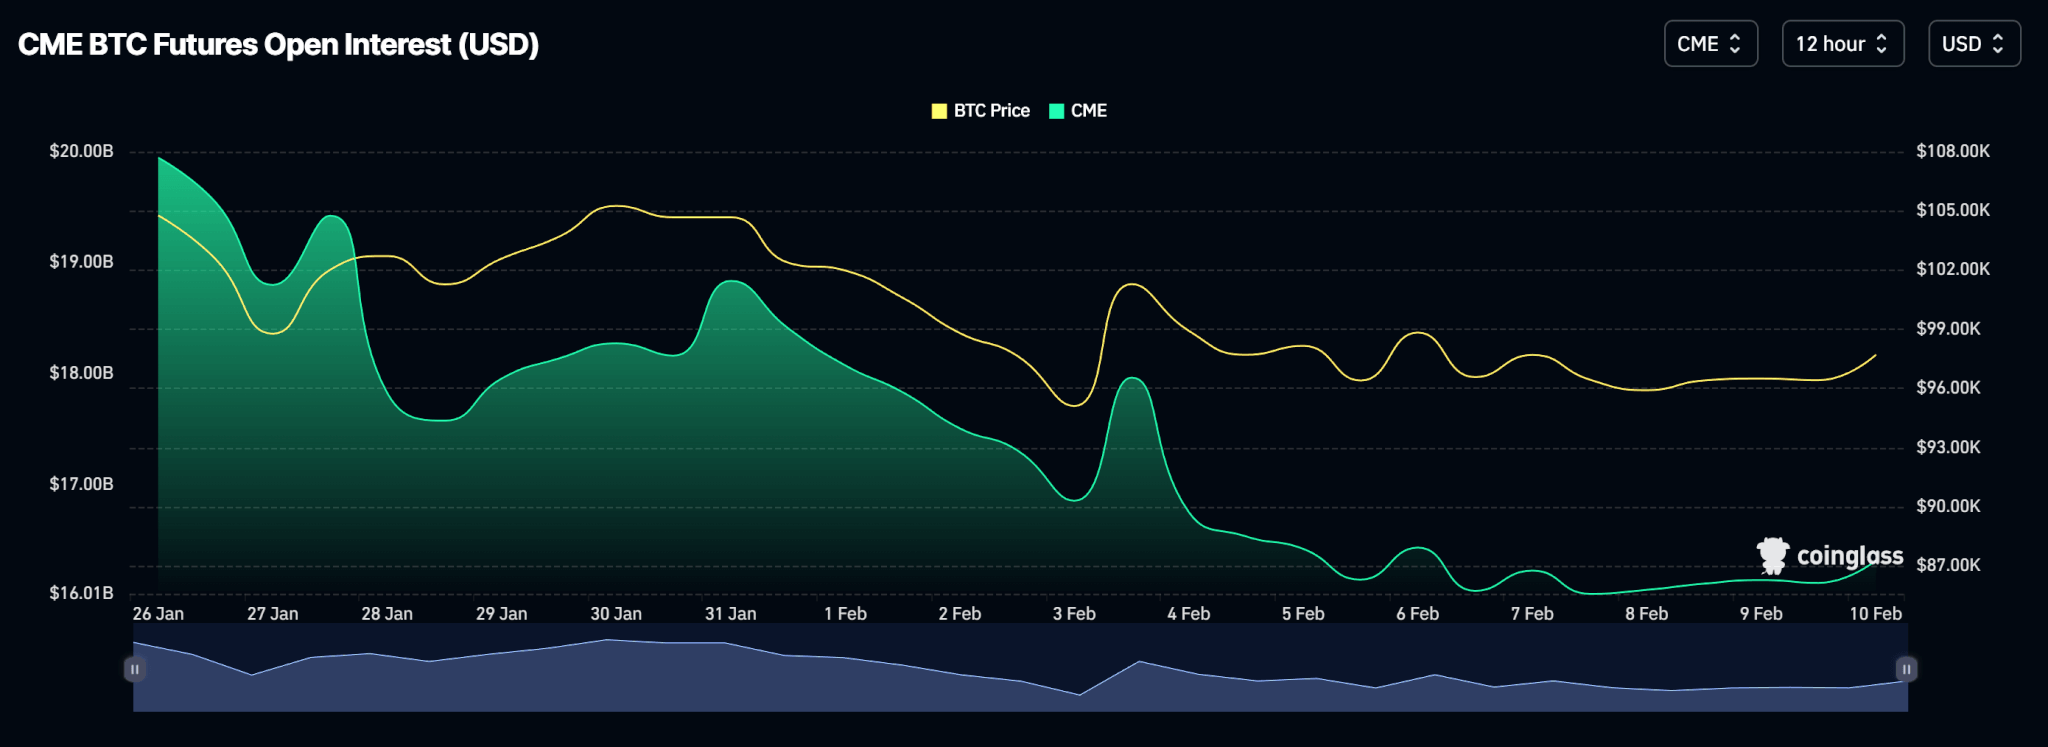
On the CME, which sees the highest trading volume for Bitcoin Futures, open interest declined last week as traders closed contracts in light of the uncertainty stemming from Trump’s tariffs.
Despite this, spot BTC ETFs reported a positive week with net flows amounting to $208.30 million, notwithstanding two days of substantial outflows.
Price Outlook
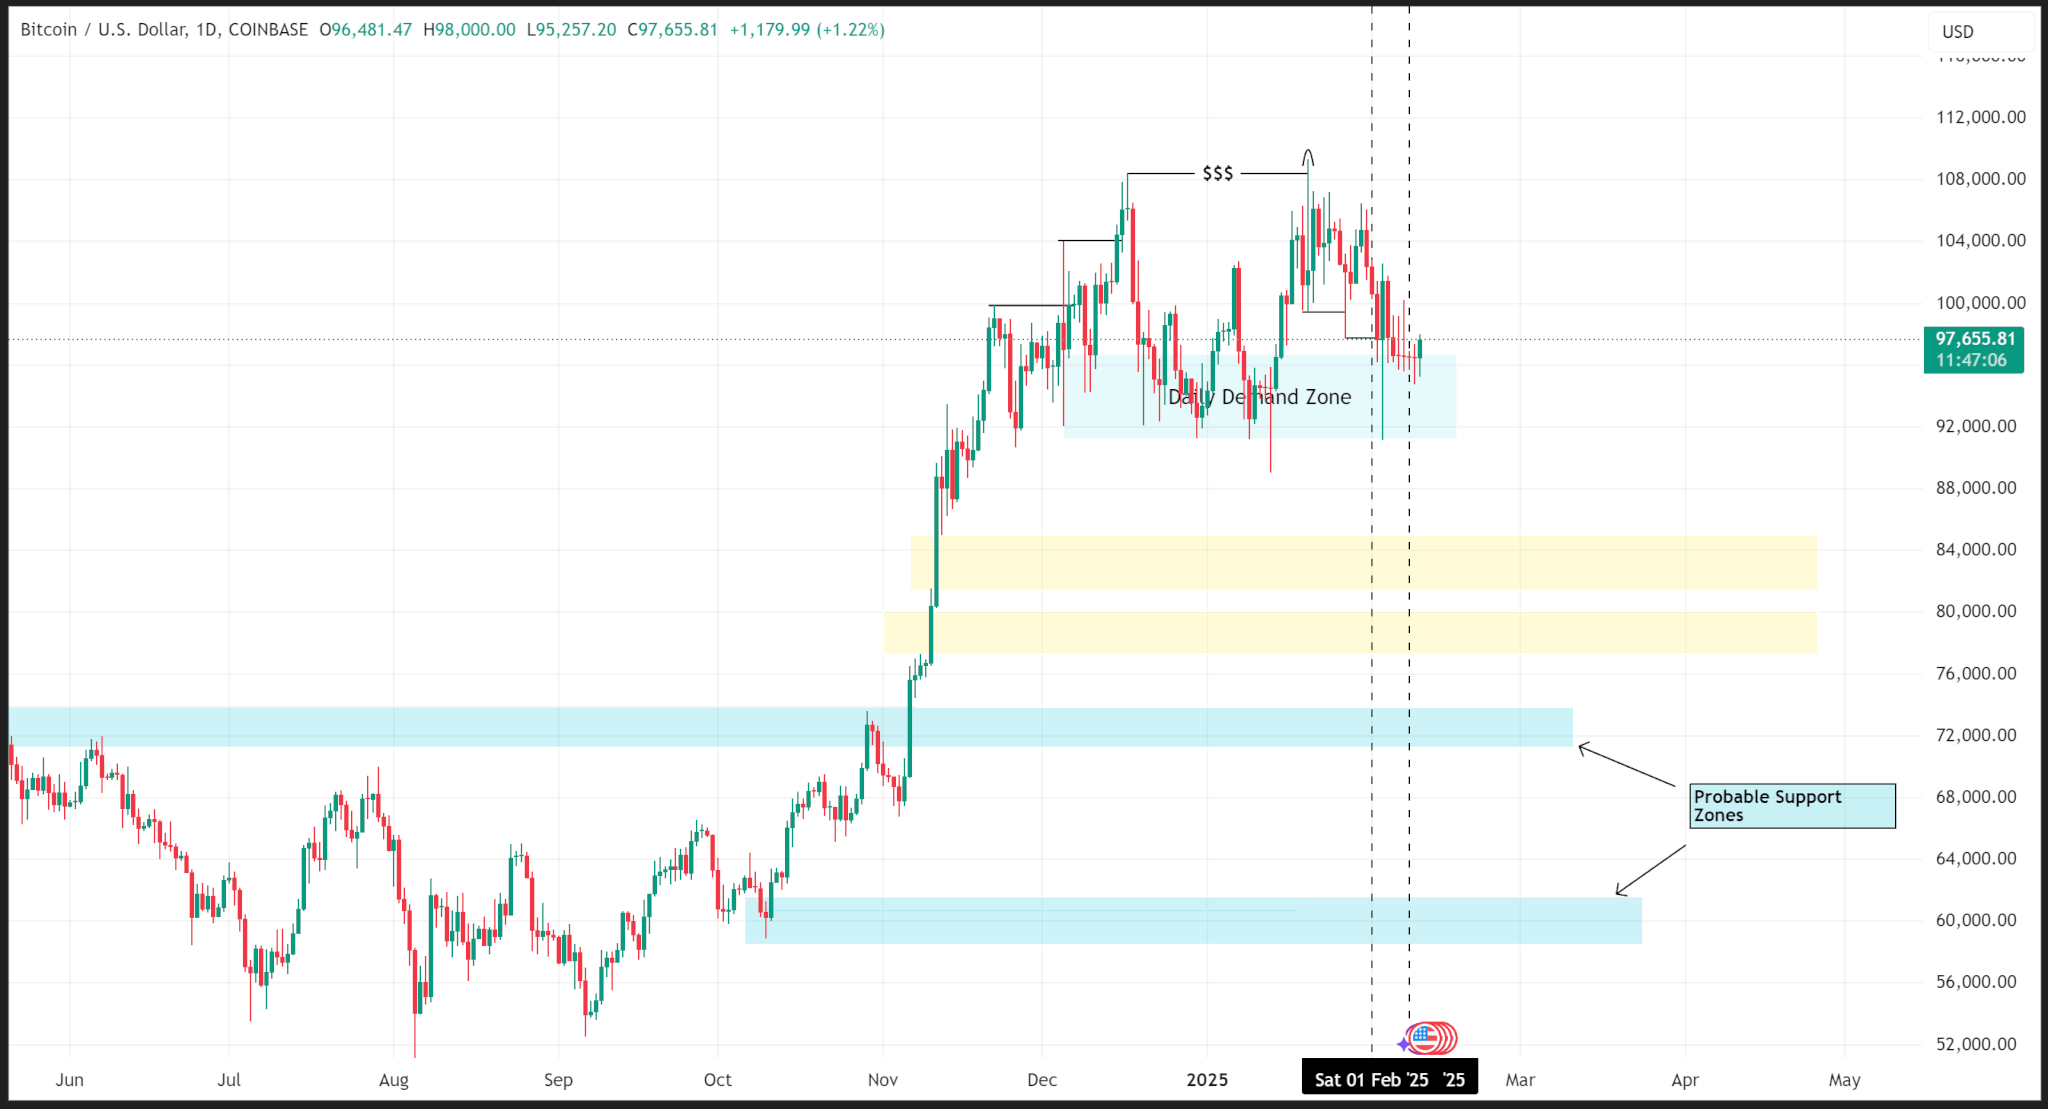
If the price sustains above the demand zone on the daily chart, then Bitcoin’s overall structure should stay bullish even in light of the substructure price declines.
However, a daily closure below the demand zone, specifically beneath the $90,000 level, could initiate a sell-off towards support levels around $84,000 or potentially lower.
BTC is trading at $97,624.73 at the time of this publication.
Ethereum
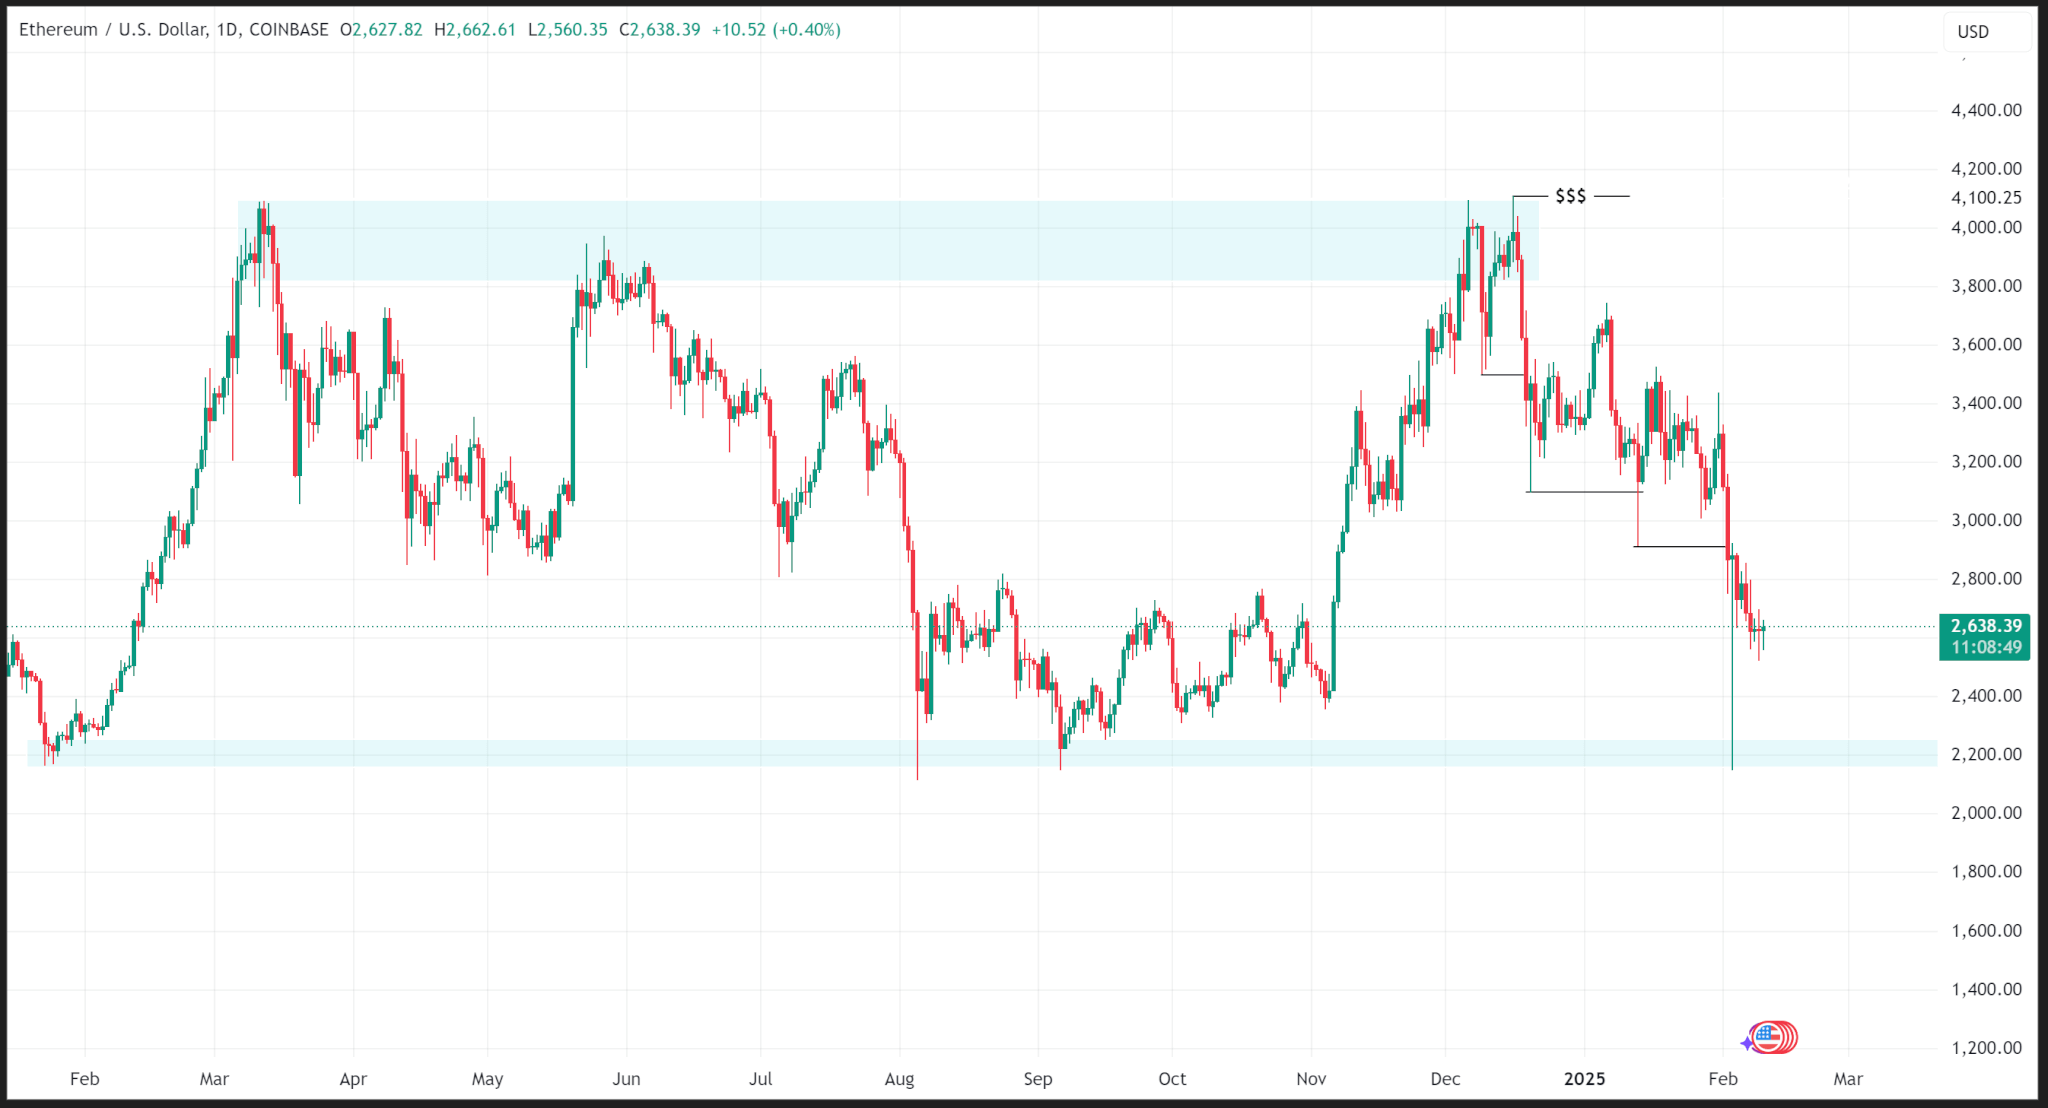
Following a failure to surpass the March 2024 highs, Ethereum’s value has been on a downtrend in its substructure since mid-December 2024.
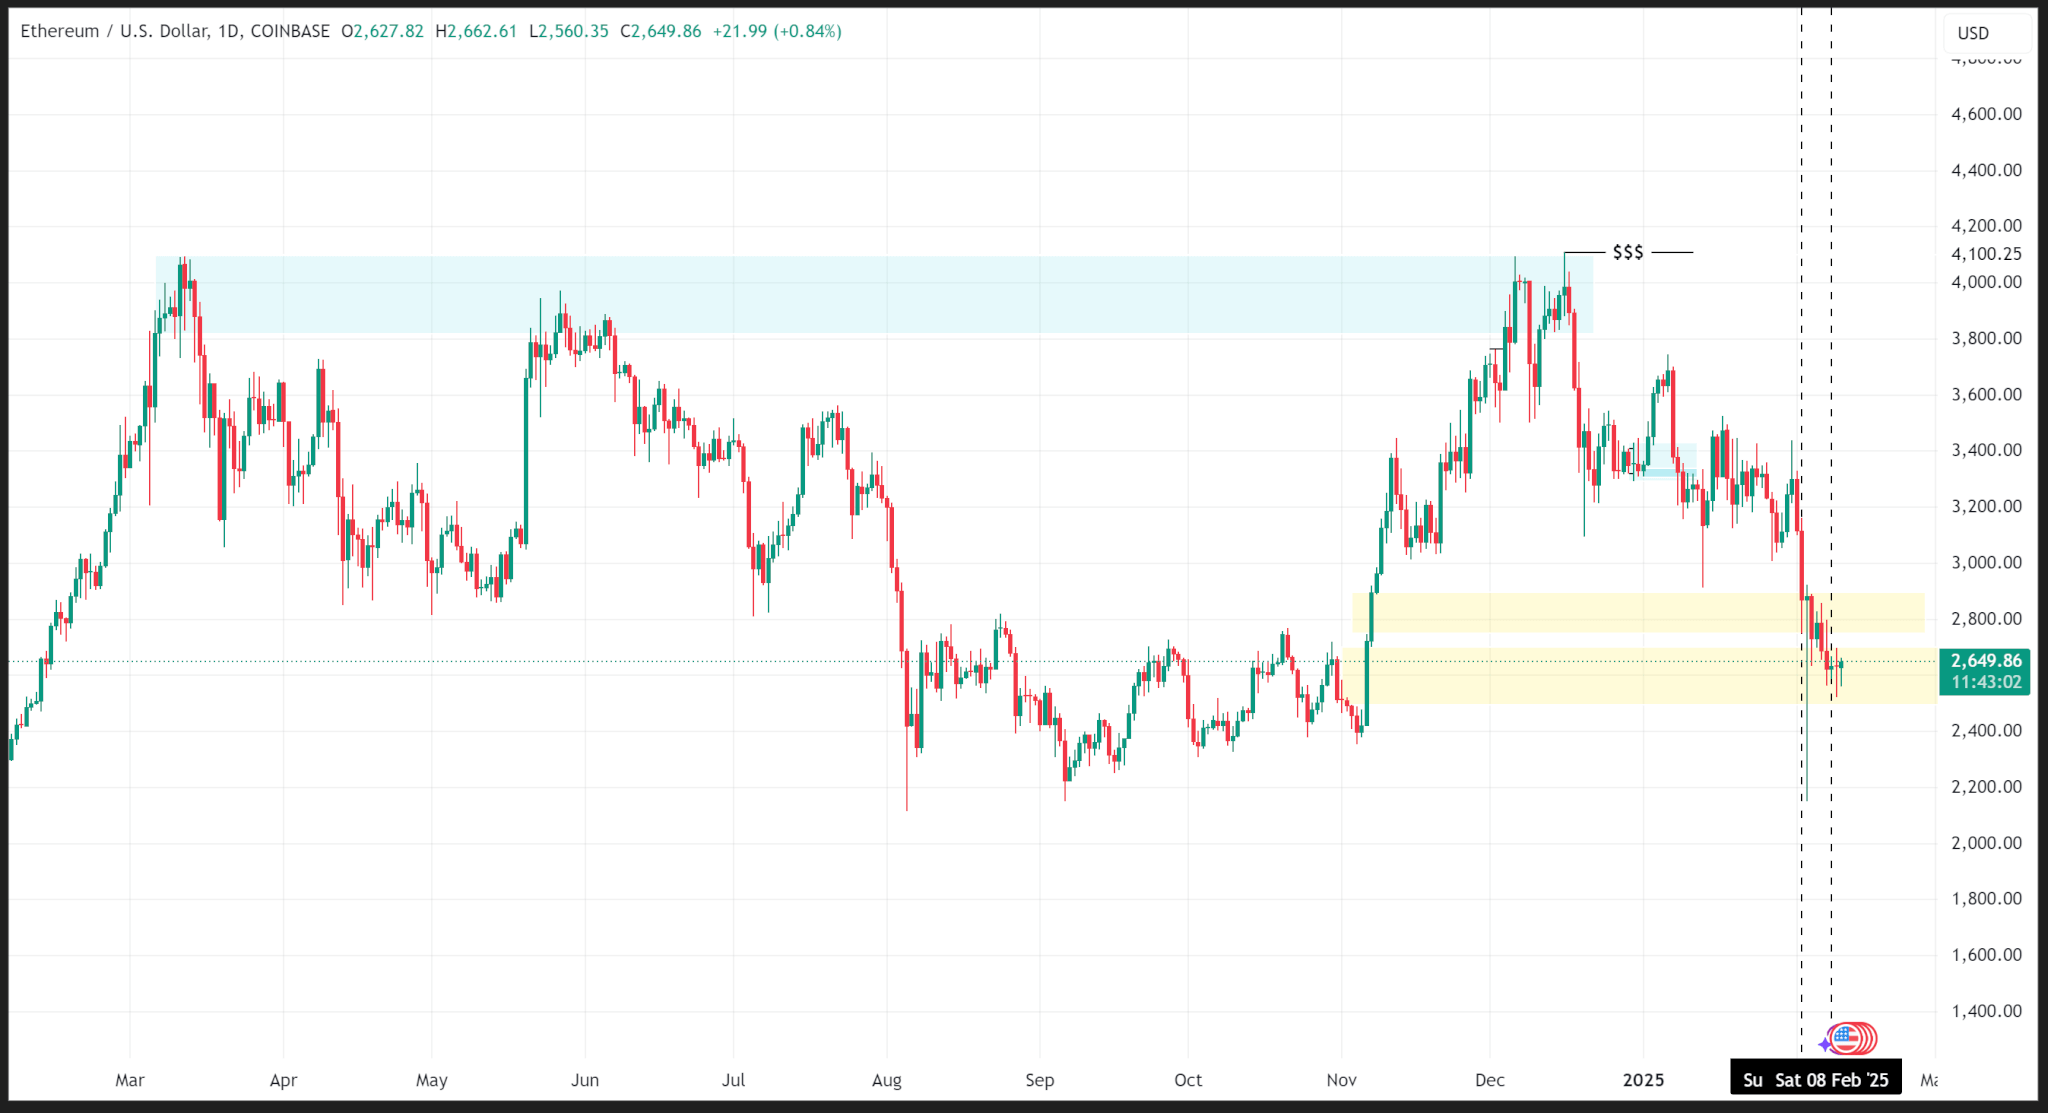
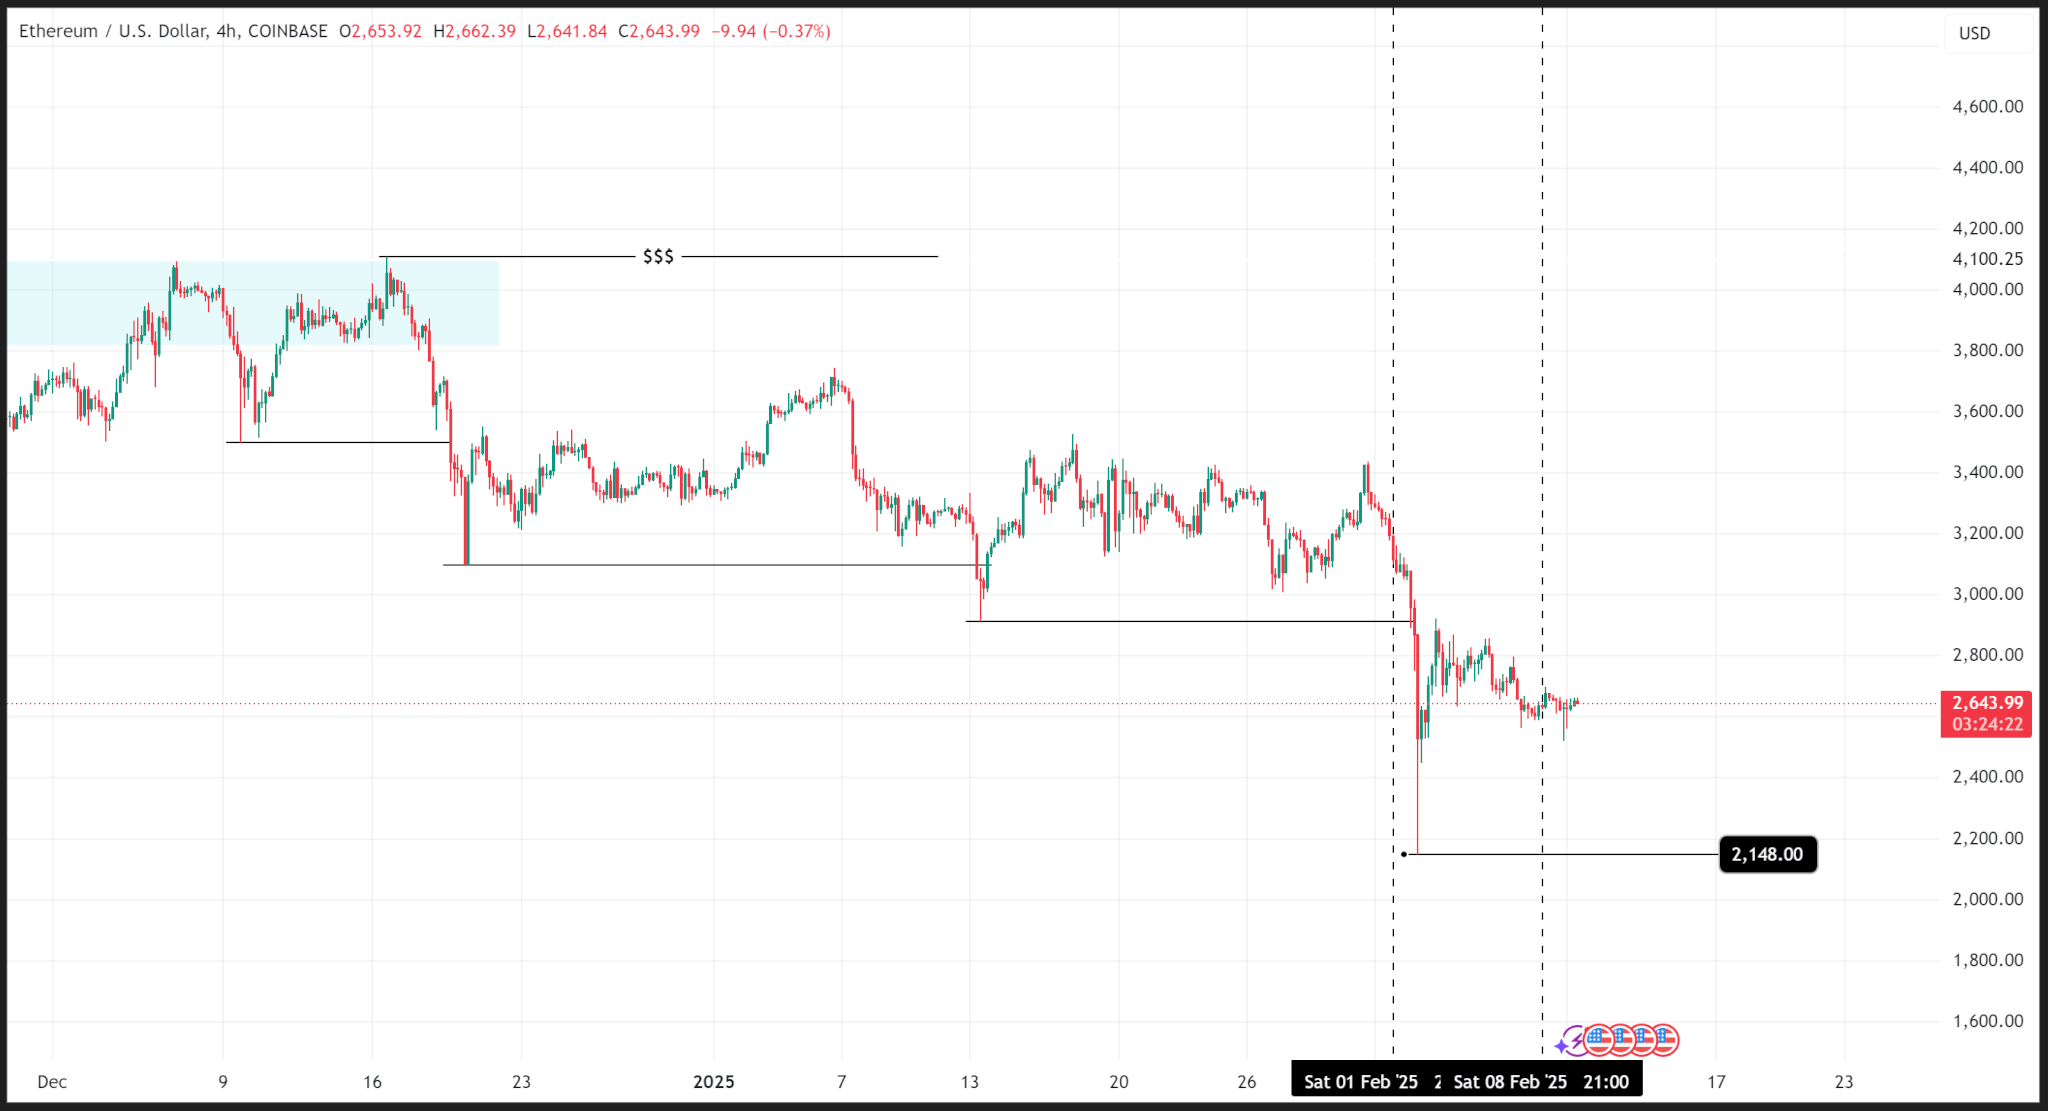
In the 4-hour chart, the price exhibited consecutive lower lows, with the most recent low of $2,148.00 reached early last week. The price has since improved, closing last week at $2,632.16.
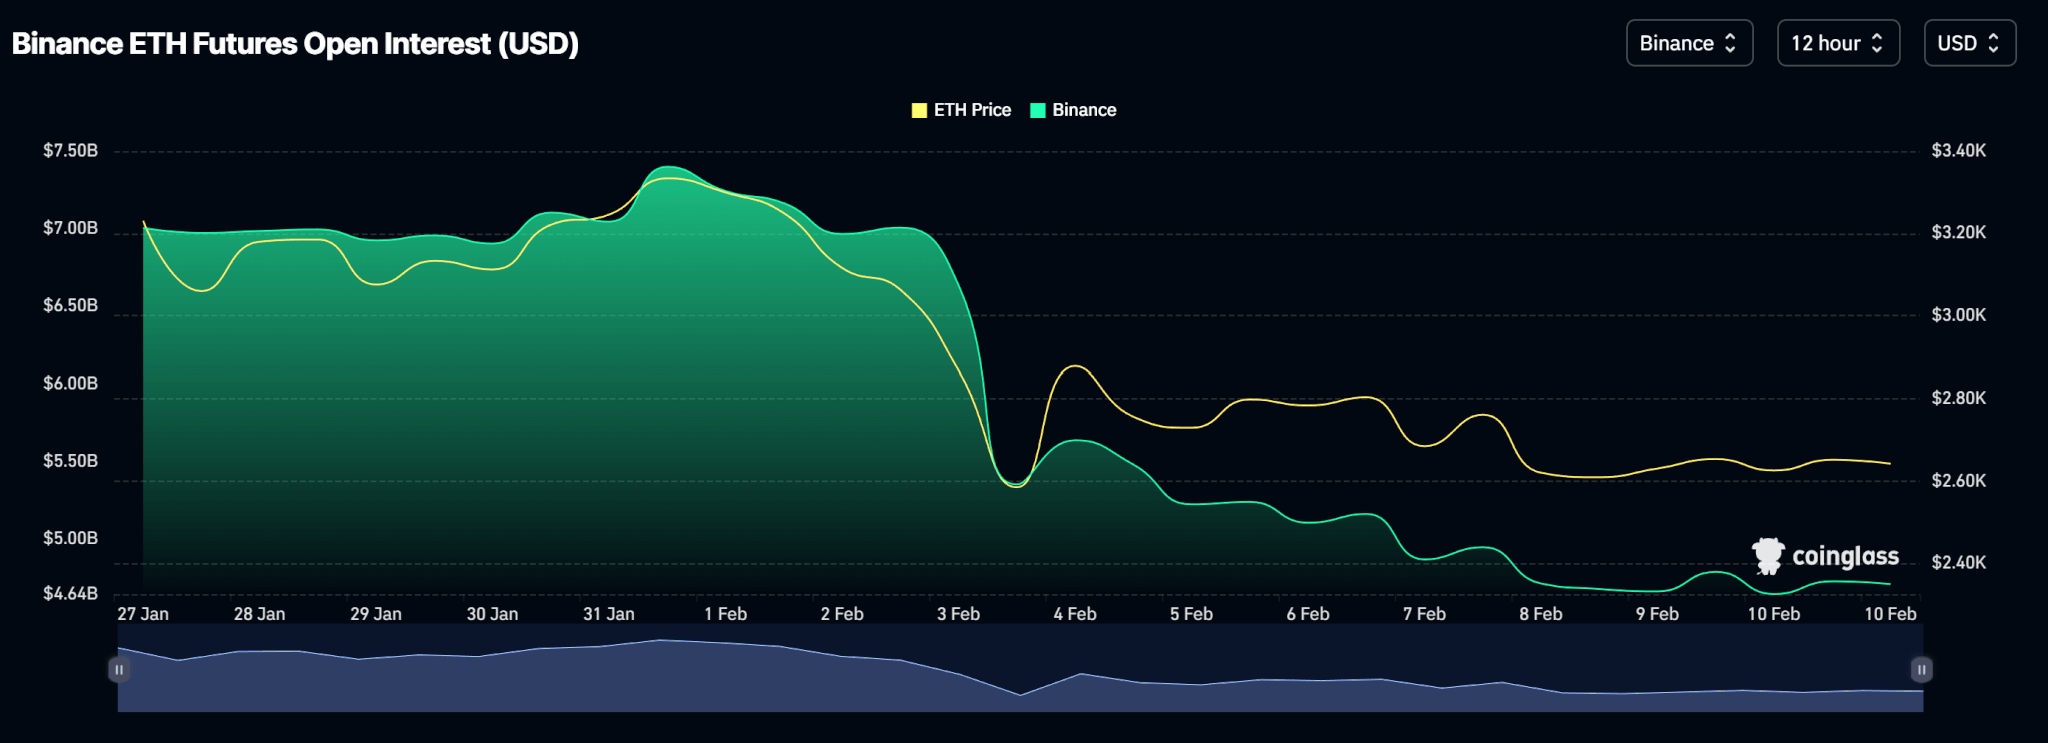
Open interest on Binance, the leading platform for Ethereum Futures trading, shows a decline in the number of active contracts, potentially serving as another driver for price declines.
In addition, spot ETH ETFs recorded positive inflows last week, except for Friday when there were no inflows (or outflows), totaling $420.20 million for the week.
Price Outlook
The next likely zone for ETH’s price to drop is a significant support area around $2,200. With Trump intending to enforce a 25% tariff on steel and aluminum alongside a new round of retaliatory tariffs against trade partners, increased uncertainty could drive ETH’s price there quickly.
ETH is trading at $2,640.05 as of this publication.


Be the first to comment