

 Hits Record Airdrop But Momentum Falters")

Pi Network (PI) has finally debuted and became the largest airdrop in cryptocurrency history, eclipsing Uniswap, though its price movements have been unpredictable since inception. Despite the considerable excitement, Pi’s ADX has diminished from 60.2 to 15, signifying a lack of distinct trends and waning market momentum.
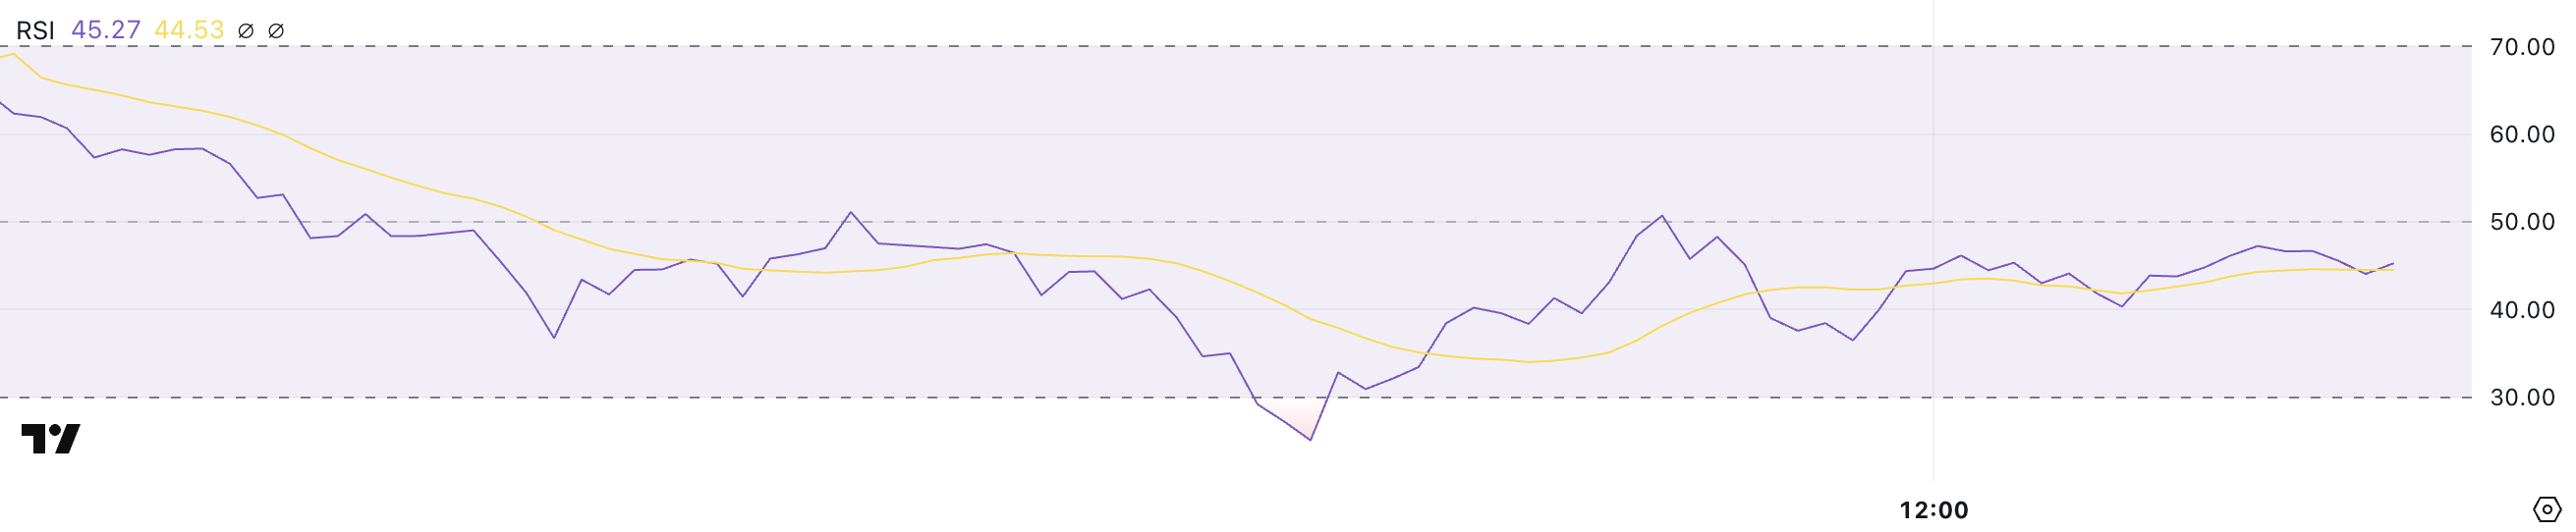
Additionally, its RSI plummeted sharply from over 90 to 45.2, showcasing a transition from intense buying pressure to a more measured attitude. Should selling pressure persist, Pi might challenge support at $0.71. A rebound could propel it to challenge resistance at $1.02 and potentially ascend to $1.26.
Pi Network DMI Reflects the Absence of a Clear Trend
The DMI chart for Pi Network indicates its ADX at 15, a notable decrease from 60.2 just hours prior when the token was officially introduced. It has established itself as the largest airdrop in cryptocurrency history, surpassing Uniswap. This swift drop in ADX implies a decrease in momentum and a weakening trend, indicating that the initial excitement surrounding the launch has subsided.
An ADX of 15 signifies a very feeble trend, suggesting that the market is currently indecisive and lacking in clear direction.
The decline in ADX emphasizes reducing volatility, indicating that the Pi Network price may consolidate or remain within a range until a new trend emerges.

The Average Directional Index (ADX) serves as a momentum indicator that gauges the strength of a trend without indicating its direction. Generally, an ADX below 20 denotes a weak or non-existent trend, between 20 and 40 implies a trend is forming, and above 40 signals a robust trend.
In conjunction with this, the +DI and -DI lines offer insights into buying and selling pressure. Presently, Pi Network’s +DI is at 16.3, down from over 60 just hours ago, highlighting a significant decrease in PI buying pressure. In contrast, the -DI stands at 21.6, increased from 4.2 at launch, indicating rising selling pressure.
This transition implies that the initial bullish momentum has shifted, and sellers are gaining dominance. With the ADX at such a low level and the price decreasing, the forthcoming trend remains uncertain, prompting traders to monitor for either a breakdown or a potential reversal as the market seeks clarity.
PI RSI Significantly Dropped Since Its Launch
The RSI for Pi Network currently stands at 45.2, indicating a substantial shift from its peak of over 90 during the launch. This initial surge above 90 suggested extremely overbought conditions, fueled by vigorous buying pressure and market enthusiasm.
Nonetheless, the rapid descent to 25.1 just hours ago reflects an immediate reversal in sentiment as selling pressure dominated.
The rebound to 45.2 indicates that extreme selling has calmed, yet the RSI remaining beneath 50 suggests a prevailing bearish sentiment.
The Relative Strength Index (RSI) serves as a momentum oscillator that measures the speed and changes in price movements, ranging from 0 to 100.
Typically, an RSI exceeding 70 signals overbought conditions, hinting at a potential price correction. Conversely, an RSI below 30 indicates oversold conditions, which could trigger a price rebound. With Pi’s RSI currently at 45.2, the market is neutral to slightly bearish. This reflects a cautious sentiment as traders await a clearer direction.
This status indicates the selling pressure has lessened, but buying interest remains feeble. If the RSI can ascend above 50, it could signal a bullish rebound, possibly leading to a price recovery.
However, if it retreats back toward 30, it may signify renewed selling pressure and further declines for Pi Network.
Is Pi Network Likely to Drop Below $0.70 Soon?
If selling pressure persists, Pi could challenge the support level around $0.71, where its longest EMA line is located. This is a vital zone for sustaining the current price range.
If this support fails, the bearish trend could intensify. It could result in additional declines and continued downward momentum.

Conversely, if the trend reverses and Pi gains bullish momentum, it could challenge the resistance at $1.02. A breakout above this threshold would signify renewed buying interest and could lead to a bullish trend reversal.
Should this resistance be convincingly breached, Pi might ascend to $1.26, representing a potential 41% upside from current values. This would confirm the termination of the bearish phase and could attract more buying activity.
Disclaimer
Following the Trust Project guidelines, this price analysis article is meant for informational purposes solely and should not be interpreted as financial or investment advice. BeInCrypto is dedicated to delivering accurate, impartial reporting, yet market conditions are subject to change without notice. Always conduct your own research and consult with a professional before making any financial decisions. Please note that our Terms and Conditions, Privacy Policy, and Disclaimers have been updated.

Be the first to comment