


Ethereum increased on April 23, climbing 10% in the previous 24 hours to negotiate at $1,795 amidst growing optimism regarding the easing of the US-China tariff disputes. Its daily trading volume has surged by 67% to $26.6 billion, reinforcing the vigor of buyer-side activity.

Ethereum price must stay above $1.6K — Analyst
Ethereum’s price fluctuated within a narrow $200 range between April 9 and April 22, as represented in the four-hour chart below. ETH’s 17% surge over the past two days enabled the altcoin to finally escape this consolidation on April 22.
A successful retest of the upper boundary of this range at $1,700 confirmed the breakout, and the price surpassed the 200-period simple moving average (SMA) at $1,751 during the early Asian trading hours on April 23.
Thus, Ethereum trades above all major moving averages in the four-hour timeframe, reinforcing the strength of the ongoing recovery.
Currently, bullish traders are targeting the April 2 range high at $1,950 and subsequently, the $2,100 resistance level.


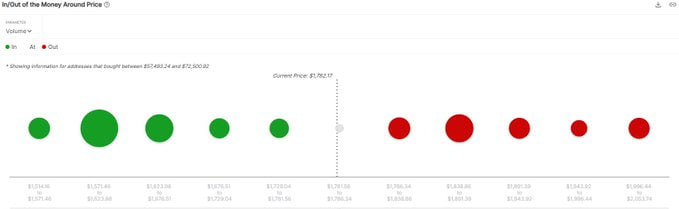
Analysts from IntoTheBlock have identified a key sell-off level for Ethereum at $1,838 based on on-chain data. If the asset can break through this mark, the return to $2k will be much easier.
On the flip side, the RSI is at 78, indicating that ETH is “overbought,” suggesting that a retreat might be imminent as buyer fatigue sets in.
If this occurs, ETH may retreat into the $1,500 and $1,700 range, where it might linger for a few more days before establishing any directional trend.
For respected analyst Rekt Capital, Ethereum must hold the area above $1,600 to maintain the upward momentum.
“Ethereum is remaining at the base of the light blue historical demand range as support, repeating history also by briefly wicking below it,” the analyst noted in part of a caption accompanying Ether’s monthly chart.
Rekt Capital was speaking of the zone between $1,600 and $2,000, within which Ethereum fluctuated for more than eight months between April 2023 and November 2023 before soaring 126% to $4,093 in March 2024.
“Ethereum needs to maintain its position here,” Rekt Capital stated, adding that if price stability can be upheld, there is a possibility that the altcoin could trigger a comparable recovery like the one observed in early 2024.

Ethereum surges alongside broader cryptocurrency market
This optimistic sentiment was not limited to Ethereum, as crypto valuations also climbed across the spectrum, initiated by diminishing tensions surrounding the US-China trade conflicts.
Bitcoin, the leading cryptocurrency, is currently trading at $94,000, having risen 6.5% in the last 24 hours. XRP, ranked fourth, has experienced an increase of more than 8% to trade just over $2.28. Solana, Dogecoin, and Cardano also saw considerable gains among the top 10 cryptocurrencies.

On April 22, 2025, President Trump informed reporters at the White House that US tariffs on Chinese goods “will be significantly reduced,” while US Treasury Secretary Scott Bessent referred to the US-China tariff standoff as “unsustainable,” suggesting a potential resolution.
Decreased trade tensions often result in heightened investor confidence in riskier assets, as global economic stability attracts capital into cryptocurrencies.
“Macro concerns persist, but one significant hurdle seems to have been resolved,” stated trading firm QCP Capital in reaction to Trump’s apparent policy change, adding:
“Trump is indicating no intention to replace Fed Chair Powell for the time being. This reassurance has triggered a slight pullback in long-end yields, aiding in the reduction of a critical tail risk.”
$110M in short ETH positions liquidated
Ethereum bullish trend on April 23 is coupled with major liquidations within the derivatives arena, indicating strong upward momentum.
More than $109 million worth of short ETH positions have faced liquidation in the previous 24 hours, compared to $22 million in long liquidations.
Bearish traders’ positions are forcibly liquidated when short holdings are closed.

The magnitude of these liquidations is reminiscent of the March 19 liquidation incident, where a total of $72.29 million in short ETH positions were eradicated. This coincided with a price increase of 13% from a low of $1,840 to a ten-day high of $2,020 on the same day.
Ethereum open interest (OI) has surged by 16% from $18.87 billion to $21.92 billion in the last 24 hours, indicating heightened trading activity in the derivatives sector.

Favorable funding rates in ETH perpetual futures markets are also a promising sign. Funding rates illustrate the periodic exchanges between long and short-position holders. This metric has escalated from -0.0018% on April 21 to $0.007% at the present time.

Rising OI and positive funding rates indicate that more capital is flowing into the market, which may enhance the price increase as buying pressure accumulates.


Be the first to comment